|

AUD/JPY Price Analysis: Sees modest gains as buyers target 97.00

  • AUD/JPY edges down to 96.35 after a 0.46% gain, with bullish-harami pattern suggesting potential upside momentum.
  • Buyers aim for the January 2 high of 96.71 and the 97.00 mark, with subsequent resistance levels at 97.67 and 98.00.
  • If the upside is capped, sellers might target Senkou Span B at 96.14 and Kijun Sen at 95.90, with 94.58 as further support.

The AUD/JPY registered moderated gains on Wednesday of 0.46%, though it begins Thursday’s session on a lower note, trading below yesterday’s close of 96.42. Nevertheless, buyers reclaiming the Kijun-Sen and stepping in around the bottom of the Ichimoku Cloud (Kumo) has opened the door for further gains. At the time of writing, the cross-pair exchanges hands at 96.35, down 0.07%.

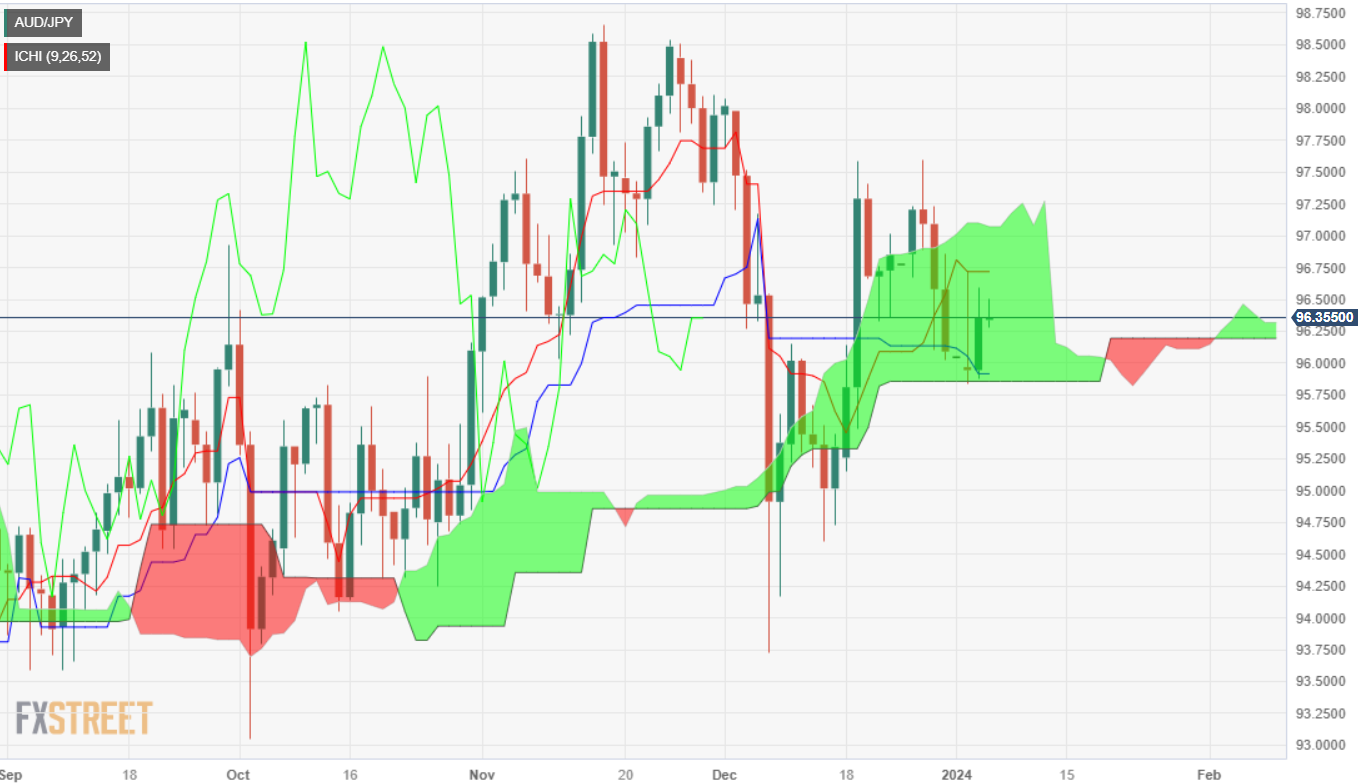
The daily chart portrays the pair range-bound, though the formation of a ‘bullish-harami’ candlestick pattern could pave the way for further upside. For a bullish resumption, buyers must conquer the January 2 high of 96.71, followed by the 97.00 figure. Once those two levels are cleared, the next resistance level would be the June 19 high at 97.67. Up next would be the 98.00 psychological level.

On the other hand, if sellers capped the AUD/JPY advance above 96.71, sellers could step in and drag prices toward th Senkou Span B at 96.14, followed by the Kijun Sen at 95.90. Once that is achieved, the next demand area to test would e the December 14 low of 94.58.

AUD/JPY Price Action – Daily Chart

AUD/JPY Technical Levels

AUD/JPY

Overview
Today last price96.4
Today Daily Change0.46
Today Daily Change %0.48
Today daily open95.94
 
Trends
Daily SMA2096.16
Daily SMA5096.67
Daily SMA10095.68
Daily SMA20094.18
 
Levels
Previous Daily High96.72
Previous Daily Low95.84
Previous Weekly High97.6
Previous Weekly Low96.03
Previous Monthly High98.07
Previous Monthly Low93.73
Daily Fibonacci 38.2%96.18
Daily Fibonacci 61.8%96.38
Daily Pivot Point S195.62
Daily Pivot Point S295.29
Daily Pivot Point S394.74
Daily Pivot Point R196.49
Daily Pivot Point R297.04
Daily Pivot Point R397.37

Author

Christian Borjon Valencia

Markets analyst, news editor, and trading instructor with over 14 years of experience across FX, commodities, US equity indices, and global macro markets.

More from Christian Borjon Valencia
Share:

Editor's Picks

EUR/USD looks apathetic around 1.1770

EUR/USD comes under renewed pressure on Tuesday, deflating below the 1.1800 support and reversing two consecutive days of gains. The pair’s decline follows the persistent move higher in the US Dollar, as trade uncertainty dominates the sentiment ahead of President Trump’s SOTU speech.

GBP/USD regains 1.3500 and above

GBP/USD extends its advance for the third day in a row on Tuesday, this time retesting the area beyond the 1.3500 hurdle. Cable’s uptick comes despite decent gains in the Greenback and the dovish message from the BoE’s Bailey at the UK Parliament.

Gold appears offered around $5,150

Gold is giving back a good portion of the recent multi-day rally, receding to the $5,150 zone per troy ounce amid the decent bounce in the US Dollar and mixed US Treasuty yields. In the meantime, markets’ attention remain on upcoming comments from Fed speakers.

Ripple’s DeFi shift in focus: Navigating XRPL EVM sidechain growth, XRPFi migration and liquidity

Ripple (XRP) has continued to trade under pressure, extending its decline by approximately 63% from the record high of $3.66 in July. The remittance token is trading above support at $1.35, while its upside appears limited by key supply zones, starting with $1.40, at the time of writing on Tuesday.

The Citrini report: How a debatable AI narrative can shake Wall Street

That AI-related headline alone was enough to rattle investors.US stocks slid sharply on Monday after a widely circulated Citrini Research memo outlined a hypothetical “2028 Global Intelligence Crisis”, warning that rapid AI adoption could push US unemployment into double digits as early as by mid-2028.

XRP pressured by weak ETF flows and declining retail interest

Ripple (XRP) is edging lower, trading above its intraday low of $1.32 at the time of writing on Tuesday. The decline from its weekly opening of $1.39 reflects heightened volatility in the broader cryptocurrency market, accentuated by tariff-triggered uncertainty.