Aptos (APTUSD) breaks key midline: channel structure points to lower boundary test

Aptos (APTUSD), the Layer 1 blockchain platform designed for scalability and speed, finds itself in technically troubled waters. After months of respecting a well-defined descending channel, APT/USD has finally given up its midline support—and what happens next could be a textbook lesson in channel mechanics.
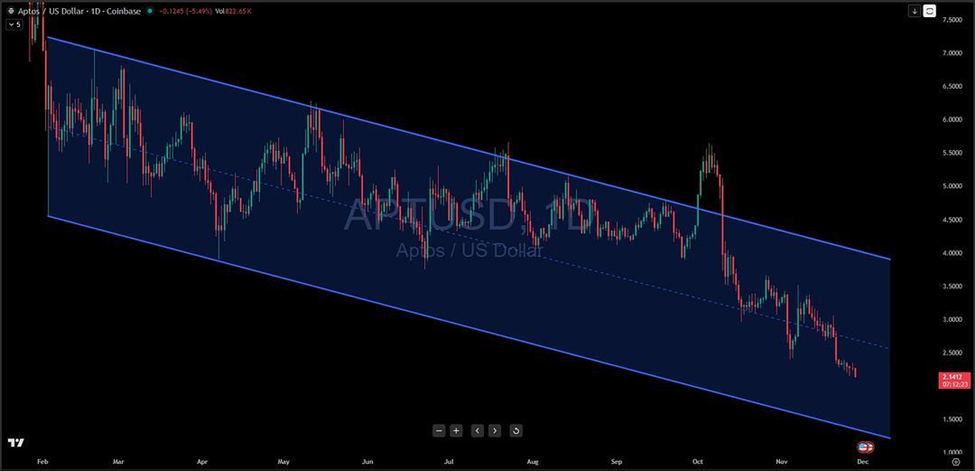
Let's break down what we're seeing. Since February, Aptos has been grinding lower within a clean parallel channel, bounded by solid blue trendlines that have contained every rally and decline throughout 2024. The upper boundary repeatedly rejected bullish attempts, while the lower boundary provided reliable support when selling pressure exhausted itself. Between these two extremes, the dotted midline has acted as a center of gravity—until recently.
That midline just broke.
Price action is currently trading at $2.1412, down 5.49% and sitting decisively below that dotted center line. This isn't just noise; when price loses the midpoint of an established channel, it typically signals that momentum has shifted toward the opposite boundary. Think of it like a pendulum—once it crosses center, physics tends to carry it toward the far side.
What strikes me here is the clarity of the setup. Channels are powerful precisely because they define expectations. Traders who understand this structure know that a midline break in a descending channel often telegraphs a move toward the lower boundary. That's exactly where my attention is focused now—the lower blue trendline sitting well below current levels, likely in the $1.00-$1.50 zone based on the trajectory.
The bearish implications are straightforward. Selling pressure has intensified enough to push price through a level that held multiple times before. This suggests either waning buying interest or increased distribution from holders looking to exit. Either way, the path of least resistance points lower.
But then, a new twist could emerge. The lower boundary has historically provided strong support when tested. If and when price reaches that lower trendline, we could see a meaningful bounce as bargain hunters step in. That's the nature of channels—they work until they don't, and each boundary offers a potential inflection point.
For traders considering short positions, the risk-reward currently favors playing toward that lower boundary. However, this setup gets invalidated if price reclaims the midline with conviction and holds it as support on a retest. That would suggest the breakdown was a false move—a bear trap rather than genuine weakness.
The key insight lies here: channels don't break randomly. They break when the balance of supply and demand shifts materially. Aptos has been under distribution pressure all year, and this midline violation confirms that sellers remain in control. The lower boundary represents the next logical target, but it's also where the most interesting battle between bulls and bears is likely to unfold.
Pay close attention to volume as price approaches that lower trendline. Capitulation selling on heavy volume could signal a washout bottom, while light volume might suggest more downside remains. My experience tells me to watch for reversal patterns—hammer candles, bullish divergence on RSI, or increasing volume on green days—as price nears that lower boundary.
What happened next will be worth watching. Channel trades are among the most reliable setups in technical analysis when the structure is this clean. Aptos has given us the roadmap; now we wait to see if it follows the script.
Author

Benjamin Pool
Verified Investing
A seasoned financial expert with a passion for empowering individuals to mastering smart money management.