|

Alibaba stock battles key resistance after three-month slide

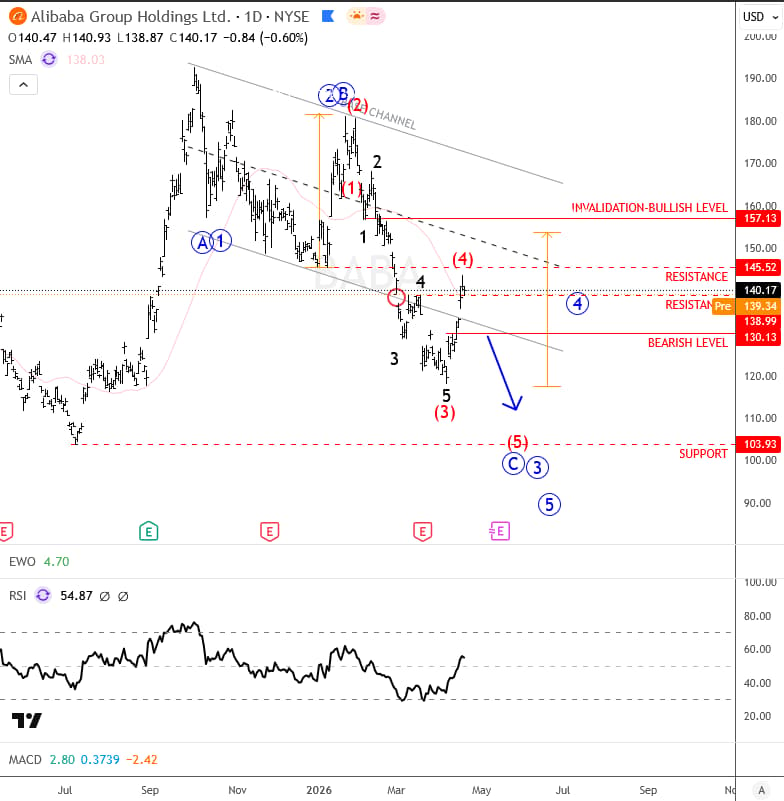
Looking at Alibaba, as you know, we have seen a very strong decline from 180 over the last three months, with price also breaking below the lower trendline of the channel. That kind of move can at times suggest we are in a wave three of an impulsive sequence rather than just an A-B-C correction.

At the same time, we are now seeing a decent rebound, but price is still stuck around previous swing highs and lows in the 140 to 145 area, which is an important decision zone for the next move. If the market turns down from here and breaks below 130, then it would suggest that bears are back in control, opening the door for a move toward 104, which is a key support from July 2025.

On the other hand, a strong push above 157 would shift the outlook back in favor of a bullish trend.

So overall, the situation remains neutral and unclear, and we need to see a break of key levels before we can confidently call the next higher degree move.

Highlights

  • Key decision zone at 140–145.
  • Break below 130 opens downside toward 104.
  • Break above 157 shifts bias bullish.
  • Structure still unclear, waiting for confirmation.
Get Full Access To Our Premium Elliott Wave Analysis For 14 Days. Click here.

Author

Gregor Horvat

Gregor Horvat

Wavetraders

Experience Grega is based in Slovenia and has been in the Forex market since 2003.

More from Gregor Horvat
Share:

Editor's Picks

GBP/USD retreats from weekly high vs firmer USD as focus shifts to BoE, US data

The GBP/USD pair struggles to capitalize on the previous day's strong move up to the weekly high and drifts lower during the Asian session on Thursday. Spot prices currently trade around mid-1.3300s, down over 0.10% for the day, and, for now, seem to have stalled the recovery move from a nearly four-week low, touched on Tuesday.

EUR/USD edges lower to near 1.1450 as Fed holds rates steady, traders await Eurozone and German GDP

The EUR/USD pair trades with mild losses around 1.1465 during the early Asian session on Thursday. The US Dollar edges higher against the Euro on a hawkish Federal Reserve rate hold. Traders brace for the preliminary readings of the Gross Domestic Product for the second quarter from Germany and the Eurozone. 


Gold eyes $4,000 and US GDP amid fresh US-Iran tensions

Gold faces rejection once again above $4,100 in the aftermath of the Fed verdict-led volatility. The US Dollar pauses post-FOMC sell-off as the US launches fresh strikes on Iran. A daily closing above $4,100 and the RSI above 50 are needed to negate Gold’s bearish outlook.

Mixed signals leave XRP and XLM at crossroads

Ripple and Stellar are trading at critical technical levels on Thursday. XRP has stabilized above the psychological $1.00 support, while XLM is testing support at $0.173. Traders should be cautious as mixed derivatives metrics keep the outlook uncertain for both altcoins. Derivatives data shows mixed sentiment among traders. CoinGlass’ long-to-short ratio for XRP reads 1.02 on Thursday.

Fed review: Reversing course (?)
At face value, the FOMC's 9-3 split decision hold was exactly in line with the expectations we laid out in our Fed preview - a divided hold, 22 July. We also named the three dissenters - Hammack, Logan and Kashkari - as the most likely hawks to support rapid tightening.
US Dollar mid-year outlook: Exceptional currency, exceptional risks?
The US Dollar enters the second half of 2026 in a markedly different position from a year ago. The King currency has recovered, reflecting persistent US inflation, changing expectations for Fed policy, geopolitical tensions and renewed demand for defensive assets.














