Advanced Micro Devices Stock News and Forecast: AMD technical indicators predict bearish reversal
- Advanced Micro Devices dropped below the 21-day moving average on December 2.
- Investment funds have switched from Intel to AMD stock.
- BofA says AMD to continue taking market share from Intel.

Advanced Micro Devices (AMD) did not recover much ground on Thursday from Wednesday's major sell-off. The rising star of the data centre semiconductor space rose 1% on Thursday after plunging 6% on Wednesday. Thursday's gain underperformed the 1.4% rise in the S&P 500. AMD stock is up 0.3% to $151.16 in Friday's premarket.
Advanced Micro Devices (AMD) Stock News: AMD advancing on Intel, says BofA
Shares of Advanced Micro Devices are up 63% year to date compared with the 37% growth seen in the Philadelphia Semiconductor Index (SOX). Recently, an analyst note from Bank of America (BAC) said for the first time in its history AMD stock has a greater percentage of ownership by investment funds. The bank said Intel stock ownership by funds has fallen 6.3% YoY to 23.1%, while funds now own 26.5% of AMD.
BofA ascribed this turn to AMD continuing to take market share from Intel on both the PC and data center fronts.
On Tuesday, AMD's CEO, Lisa Su, said she expects the acquisition of Xilinx to be complete before the end of the year. That means a lot of lawyers may be working on Christmas. The company has received anti-trust approval in the US and Europe but is waiting on feedback and approval from third-party partners in China.
AMD key statistics
| Market Cap | $191 billion |
| Price/Earnings | 49 |
| Price/Sales | 13 |
| Price/Book | 27 |
| Enterprise Value | $188 billion |
| Operating Margin | 21% |
| Profit Margin |
27% |
| 52-week high | $164.46 |
| 52-week low | $72.50 |
| Short Interest | 6% |
| Average Wall Street Rating and Price Target | Buy, $141.50 |
Advanced Micro Devices (AMD) Stock Forecast: Autumn bull run slowing down
One concering feature of Thursday's recovery is that AMD stock traded well below the 21-day moving average at $146.56 though it closed at $150.68. The space between the 9-day and 21-day moving averages is closing, and Thursday's momentary break below the 21-day may signal that change is afoot.
Many traders have already noted that the Moving Average Convergence Divergence (MACD) already crossed lower on Wednesday. This typically happens when a correction is beginning. A pullback would first need a close below the 21-day moving average, which sits at $150.37 at the time of writing. AMD stock has remained above the 21-day moving average since October 6.
Support can be found at $140 and then again at $130, near the S1 pivot. There is no reason to be bullish until AMD price closes above $160 again.
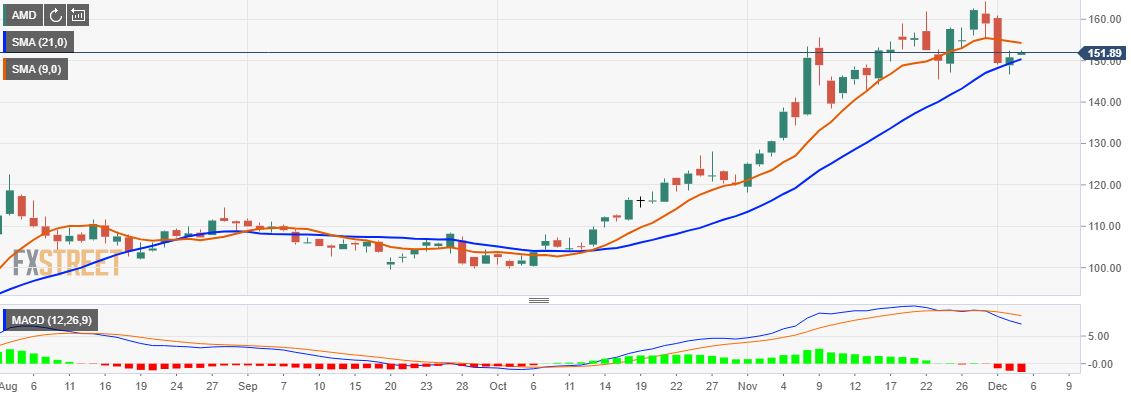
AMD 1-day chart
Like this article? Help us with some feedback by answering this survey:
Author

Clay Webster
FXStreet
Clay Webster grew up in the US outside Buffalo, New York and Lancaster, Pennsylvania. He began investing after college following the 2008 financial crisis.

















