Gold finds relief from Oil’s decline as traders await key US economic data
- Gold starts the week on a positive note as Oil prices fall amid renewed US-Iran diplomatic efforts.
- Persistent inflation concerns and hawkish Fed expectations continue to limit Gold's upside.
- XAU/USD's technical outlook remains bearish as the RSI approaches oversold territory.

Gold (XAU/USD) retains a positive bias during American trading hours on Monday after sliding to a fresh yearly low of $3,870 on Friday and ending October down 6.87%. A pullback in Oil prices amid diplomatic efforts between the US and Iran supports the precious metal. However, the rebound lacks conviction as the fundamental backdrop continues to raise doubts over a sustained recovery.
At the time of writing, XAU/USD trades around $3,900, up 0.64% on the day, after reaching an intraday high of $3,919.
“Exchange of messages with the US continues,” Iran’s Foreign Ministry spokesman Esmaeil Baghaei said on Monday, adding that Deputy Foreign Minister Kazem Gharibabadi was in Doha to facilitate the process.
Iran said its proposal could reopen the Strait of Hormuz within two days of an agreement, provided Washington ends its naval blockade and meets Tehran’s demands. West Texas Intermediate (WTI) slips below $100 a barrel, down around 3.20% on the day.
Gold now trades around 30% below its all-time high near $5,600 set in January. Since the US-Iran war began in late February, the metal has largely moved opposite Oil, as elevated energy prices drove inflation higher and prompted central banks, particularly the Federal Reserve (Fed), to tighten monetary policy.
Geopolitical uncertainty and inflation typically encourage demand for Gold. This time, however, the prospect of higher interest rates weighs more heavily on the metal, which pays no yield.
Gold has also failed to gain support from the AI-led technology sell-off, despite the resulting weakness in the US Dollar (USD) and Treasury yields, as traders sell the metal to meet margin calls and cover losses elsewhere.
The US Dollar Index (DXY), which tracks the Greenback’s value against a basket of six major currencies, trades around 101.60, down 0.37% on the day. Meanwhile, the benchmark 10-year US Treasury yield holds near a seven-week low at 4.92%, well below October’s peak of 5.36%, its highest level since 2002.
What to watch next
Attention now turns to the US midterm elections on November 3, which could influence the US Dollar and, in turn, Gold. Traders also face a busy economic calendar as they look for clues on the Fed’s interest rate path. Monday brings the ISM Manufacturing Purchasing Managers Index (PMI), followed by JOLTS Job Openings on Tuesday. ADP Employment Change and the ISM Services PMI are due Wednesday, ahead of Friday's Nonfarm Payrolls (NFP) report.
The Fed voted 10-2 to keep interest rates unchanged at 3.75%-4.00% in October, following September’s 25-basis-point (bps) increase, opting for a patient approach in its fight against inflation. Traders price in a 72% chance of a December rate hike, according to CME FedWatch.
Technical analysis: Weak momentum keeps further losses on the table
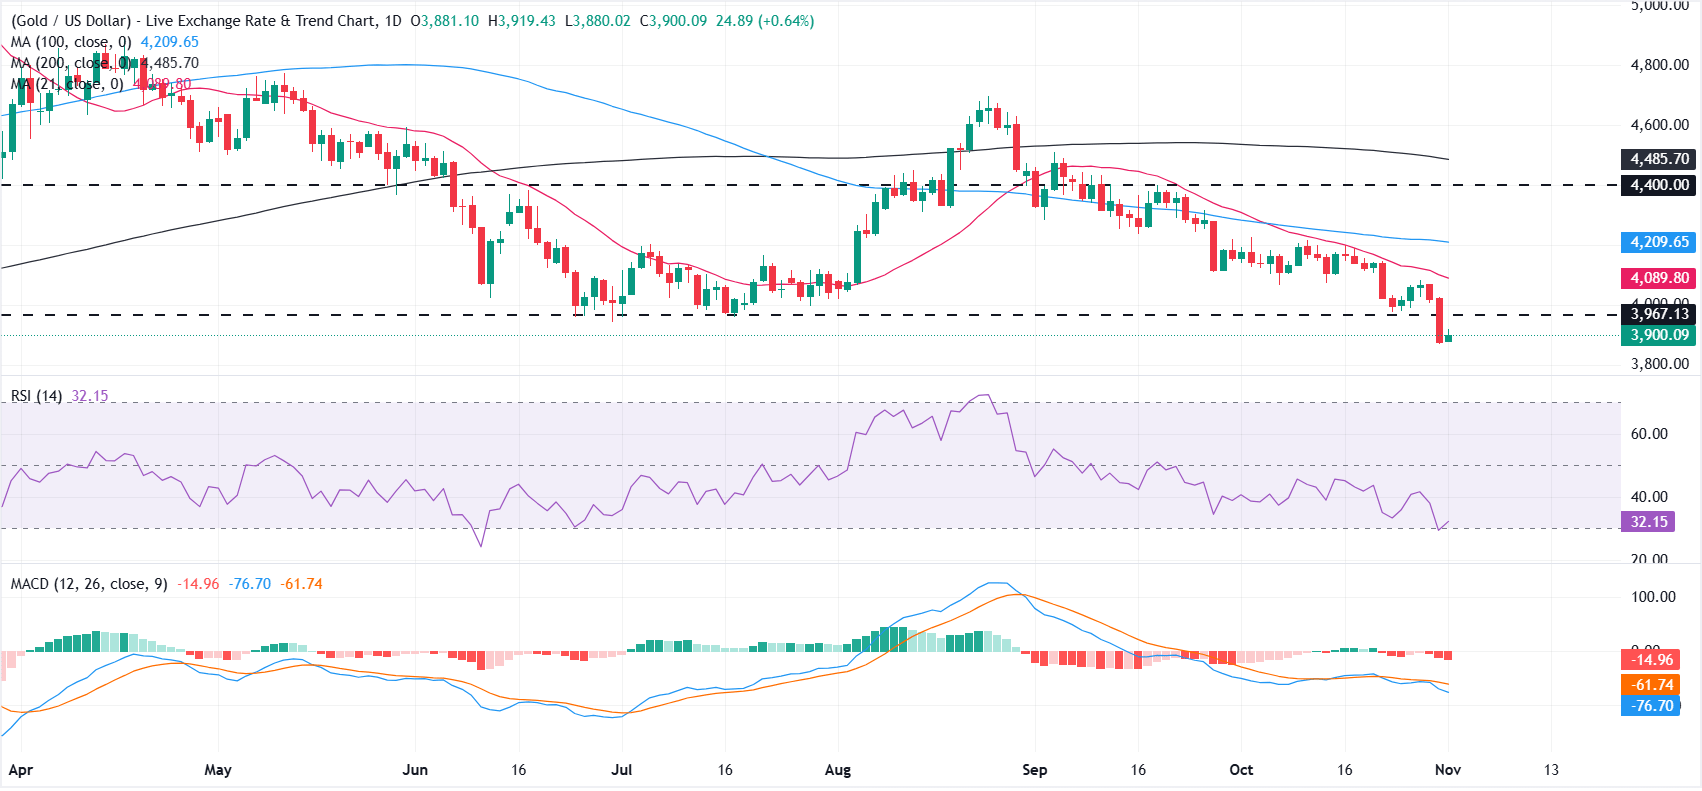
On the daily chart, XAU/USD maintains a bearish outlook as it trades below the 21-day, 100-day and 200-day Simple Moving Averages (SMAs).
The Relative Strength Index (RSI) at 32 hovers just above oversold territory, while the Moving Average Convergence Divergence (MACD) remains below zero with a negative reading, which together hint that downside momentum is still dominant, even if the sell-off is becoming stretched.
On the upside, immediate resistance lies in the $3,950-$4,000 region, followed by the 21-day SMA at $4,089. Above there, the 100-day SMA at $4,209 and a higher horizontal barrier near $4,400 form a broader supply zone, before the 200-day SMA at $4,485 comes into play as a more distant structural ceiling.
On the downside, Gold remains vulnerable to further losses, with immediate support at Friday's yearly low of $3,870. A break below this level could pave the way for further declines.
(The technical analysis of this story was written with the help of an AI tool. Know more.)
US midterm elections FAQs
The US midterm elections are the federal elections held halfway through a president's four-year term. Voters choose all 435 members of the House of Representatives, about one-third of the Senate, and, in many states, governors and other state and local officials.
Election Day is Tuesday, November 3, 2026. Federal law sets it as the Tuesday after the first Monday in November. Early voting and mail voting are already under way in many states.
They decide which party controls each chamber of Congress for the last two years of President Donald Trump's term. The majority party sets the legislative agenda, chooses committee leaders and, in the Senate, controls confirmations of judges and senior officials.
No. The president is elected every four years; the next presidential election is in November 2028. Midterms are often seen as a referendum on the sitting president's party, which historically tends to lose House seats.
Most analysts expect a modest, short-lived reaction in the US Dollar rather than a lasting trend. A divided Congress is widely seen as the base case and is partly priced in. Treasury yields may react more noticeably to the results. Outcomes that raise expectations of fiscal stimulus tend to lift yields and the US Dollar, while gridlock that limits new spending can pull both lower. Political friction, such as funding or debt-ceiling standoffs, can also briefly lift the Dollar as a safe haven. Over six to twelve months, growth and Federal Reserve policy matter more than the vote.
US stocks have historically been weak before midterms and strong after them. Since 1950, the S&P 500 has been higher 12 months after every midterm election, 19 out of 19, with an average gain of about 15%. Analysts link the pattern to uncertainty fading once results are known. Past performance does not guarantee future returns, and some strategists note that high valuations in 2026 could test the streak.
Markets have often welcomed a divided government because gridlock makes sweeping changes to taxes, spending and regulation less likely. Under a Republican president, the S&P 500 has historically done well in years following midterms that split control of Congress. The risks are funding deadlines, debt-ceiling fights and congressional investigations, which can add short-term volatility.
Author

Vishal Chaturvedi
FXStreet
I am a macro-focused research analyst with over four years of experience covering forex and commodities market. I enjoy breaking down complex economic trends and turning them into clear, actionable insights that help traders stay ahead of the curve.