Technical Analysis: GBP/USD

| Indicator | Value | Signal |
| RSI | Neutral | |
| MACD | Buy | |
| MA(200) | Buy | |
| Parabolic SAR | Buy | |
| Fractals | Buy | |
| Donchian Channel | Buy |
Chart Analysis
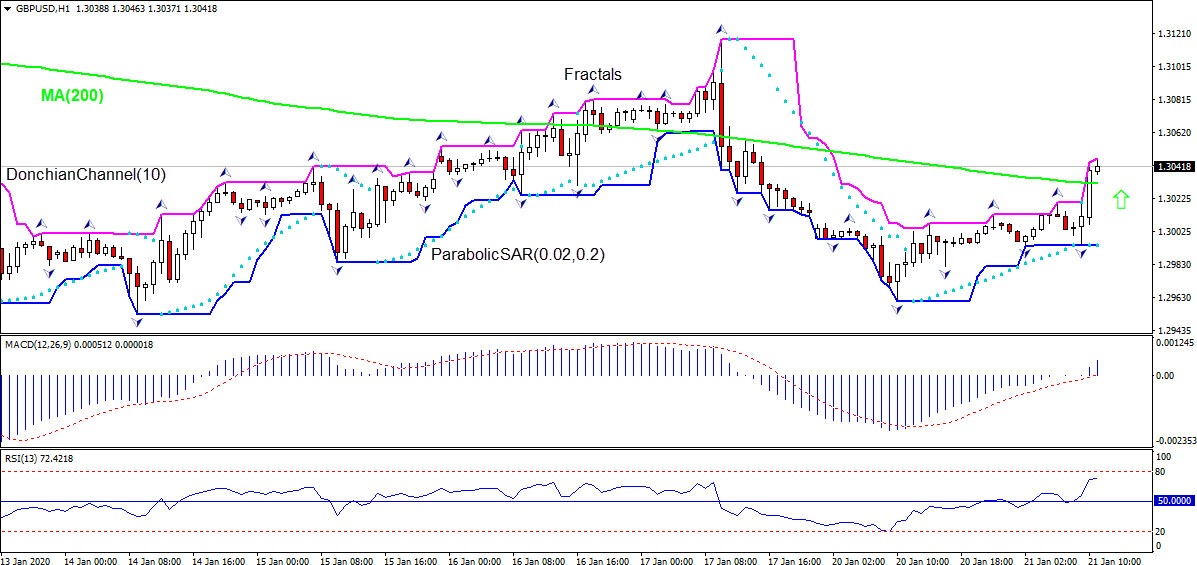
On the hourly timeframe the GBPUSD: H1 has breached above the declining 200-period moving average MA(200).
We believe the bullish momentum will continue after the price breaches above the upper boundary of Donchian channel at 1.3046. A level above this can be used as an entry point for placing a pending order to buy. The stop loss can be placed below 1.3036. After placing the order, the stop loss is to be moved to the next fractal low, following Parabolic signals. Thus, we are changing the expected profit/loss ratio to the breakeven point. If the price meets the stop loss level without reaching the order, we recommend cancelling the order: the market has undergone internal changes which were not taken into account.
Fundamental Analysis
The annual growth of average weekly earnings for employees in Great Britain remained unchanged at 3.2% for total pay (including bonuses) when a slowing to 3.1% growth was expected. Will the GBPUSD continue rising?
Want to get more free analytics? Open Demo Account now to get daily news and analytical materials.
Want to get more free analytics? Open Demo Account now to get daily news and analytical materials.
Author

Dmitry Lukashov
IFC Markets
Dimtry Lukashov is the senior analyst of IFC Markets. He started his professional career in the financial market as a trader interested in stocks and obligations.


