Metatrader: The Fibonacci Arcs
When trying to determine if the movement we are actually seeing is merely corrective or if it could be understood as a trend change, there is quite a simple and reliable tool we can use for that: Fibonacci arcs. Similar to speed lines, the arcs are just three trend lines that represent Fibonacci ratios instead of candle highs or lows. The 3 trend lines therefore represent the Fibonacci ratios, 38.2%, 50% and 61.8%.
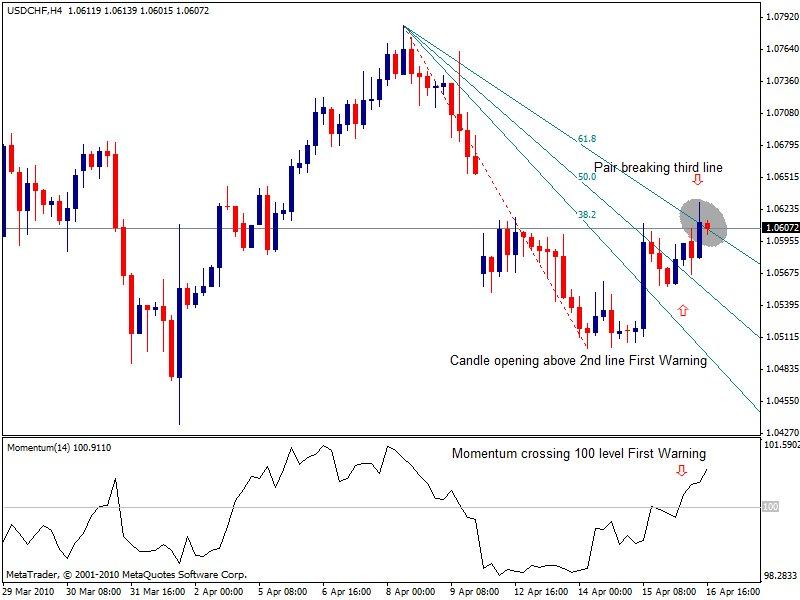
The general rule says that if you have any trend indicator, in this example momentum, once you get a sign, in this case to buy, you can filter the trade to have a more reliable signal with Fibonacci arcs. In the example you can see that actually when we get the signal in the momentum candle opening at the same time exactly above the second descendant line, the 50% retracement, giving us higher probabilities of success. A trade should be considered complete when price reaches the third trend line, the 61.8%.
But in order to determinate a trend change, the third line is the key: price action extending above this third one, along with a fresh candle opening also above it, it is usually a clear sign of a trend continuation, with indicator strength then acting as filter. Be aware the price could pull back a bit before that, continuation thus should remain limited to previous candle range in order for a valid trend continuation to occur.
Author

Mauricio Carrillo
Witbrew
Mauricio Carrillo is a financial journalist, fintech executive, and inter-markets analyst with fifteen years of experience at the intersection of traditional finance and digital asset infrastructure.


