ATR Versus IV
Often I am asked to explain how to set realistic expectations for my targets, rather than having overly enthusiastic, optimistic, and somewhat unrealistic targets. One easy answer would be: Just check the readings of the ATR (Average True Range) on the chart for the time frame that you are planning to trade. I personally prefer to use the current IV (Implied Volatility) for the simple reasons that it is more accurate and conservative. This article will be divided into two parts. In the first part, ATR will be defined, while the second will address IV to a greater length both theoretically (by using the formula) and practically (by giving specific current readings).
PART I: Average True Range
A majority of option trading platforms are equipped with charts which have multiple studies that can be inserted as lower studies. One of these multiple studies is the ATR. TradeStation supplies a valuable explanation of the ATR:
"The Average True Range indicator calculates and plots the average of these values over a certain number of bars. This indicator may be considered a tool for measuring the volatility of a market using a price range concept. Often, extremes in average true range are associated with a change in character of a market, from trending to trading range and vice versa."
This quote comes from the Market Synopsis of the TradeStation explanation for the ATR. Meanwhile, the input data (14 bars) is specified as being, "Number of recent bars used to determine an extreme value of the average true range."
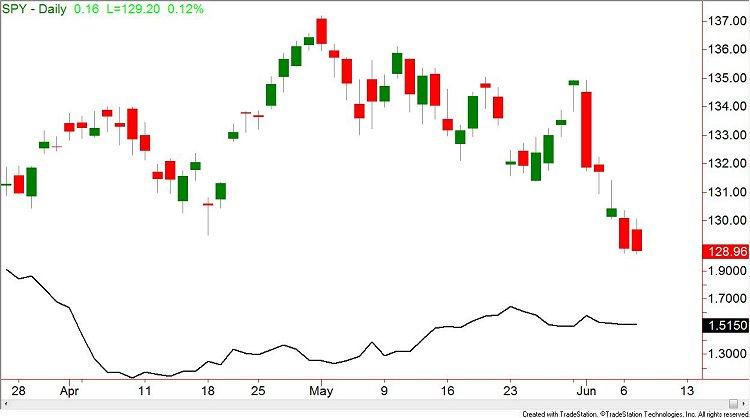
The chart below shows the daily chart of the SPY with the ATR being inserted as a lower study. Observe that the Daily ATR of the SPY is $1.37, which means that on the next trading day, the SPY could likely move either up or down a "maximum" of $1.51.
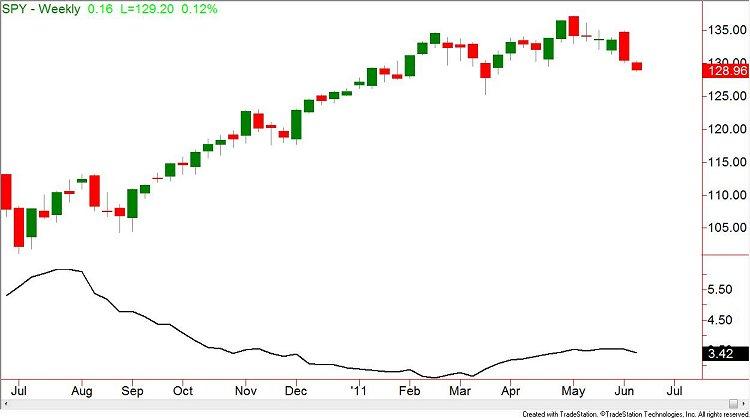
The second chart is still the SPY but the time frame was changed from the daily to the weekly. On Figure 2, we can observe that the Weekly ATR for the SPY is $3.42.
This last chart is a monthly chart and the current ATR on the monthly basis is $8.20.
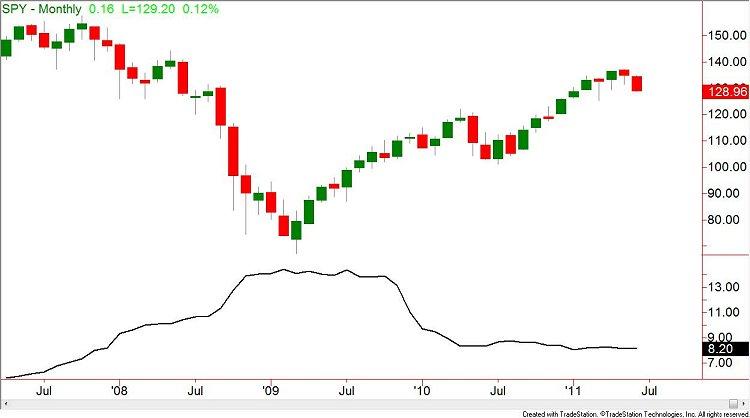
In short, what these ATR readings are telling us is the following: If we are planning a target for our shorter term trade, it is realistic to keep the target no greater than 1.51 from entry. However, if we are in a longer term trade, then the weekly ATR of 3.42 could be used as the target. And for an even longer term trade such as a position trade, the monthly 8.20 ATR could be used. Having completed the argument for ATR, let us move to the argument for using IV, which I personally believe to be more accurate.
PART II: Implied Volatility
This second part on IV will be divided into two parts: Theoretical and practical. The first part will provide the formula for finding the first Standard Deviation, and then the same formula will be applied to the current market situation.
Theoretical Explanation:
What better place to start than by using the formula that includes the current IV in order to find the reading for the first SD (Standard Deviation).
The formula:
Stock price times the stock's IV
Divided by the Square Root of the time
Equal one Standard Deviation.
The Square Root of the time could be expressed in:
1. Days = trading days in a year
256 and Square Root of 256 = 16
2. Weeks in a year 52 (Square Root of 49 = 7) Square Root of 52 = 7.2
3. Months in a year (Square Root of 9 = 3, Square Root of 16 = 4) Square Root of 12 = 3.4
Let us plug in some imaginary numbers:
Stock is trading at $100
IV = 32% (0.32)
Daily time frame
$100 x 0.32 = 32 divide by 16 = $2 as the first SD, meaning that the $100 stock could at any given day either go to $102 or $98.
It means 67% of the time, this $100 stock is going to move around two dollars.
Practical Application:
Instead of using theoretical numbers, I have pulled up the current IV readings from the CBOE website, and below are the numbers that are currently in play.
Author

Josip Causic
Online Trading Academy
Before starting his professional trading career as an LLC, Josip was an educator.
















