What a Difference a Week Makes!
This past week has been one to remember. We saw the first ever credit downgrade of the US Debt, wild market swings, promises of low interest rates through 2013 and potential trouble in French Banks. Last week, I wrote that we would be heading through the summer doldrums until we started the 1977-like drop in late August; instead, it looks as though the party has started.
Sometimes it takes a jolt like the one we just had to make me look at my analysis and see if it is really that bearish or if the news is sensationalizing the conditions. This week, I will go back to some techniques I have discussed in past articles. A tool that I use that combines the fundamental knowledge tool of sector rotation with some technical timings is the spread ratio analysis.
You may recall that investors tend to buy consumer discretionary stocks when they expect the market to become bullish. These companies manufacture and sell products that we tend to purchase when we have extra income and the economy is thriving. On the other hand, when times get tough, consumer staples become an investor's safe haven. We consume these products regardless of economic conditions. By viewing the ratio of the discretionary to staple ETFs, a trader can identify when the markets are shifting from bullish to bearish and back again.
When discretionary stocks are out-performing the staples, the ratio will rise and a bullish market is expected. However, should the line drop, it shows investors are worried and running toward the safety of the staples. The main use of this tool is to identify trends in the markets and potential shifts in investor sentiment.
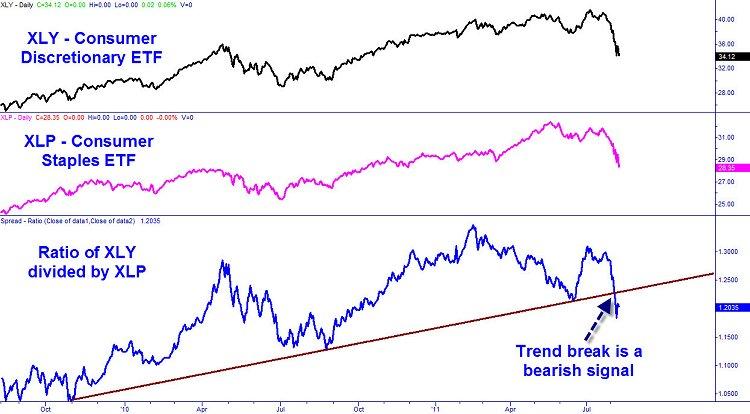
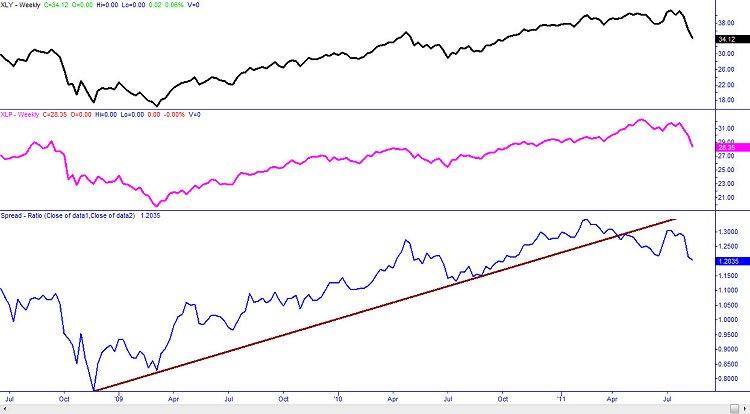
The daily picture is one thing, but when we look at the ratio of the XLY:XLP on a weekly basis, we can see that we have finally broken the bullish trend that had been in place since 2009!
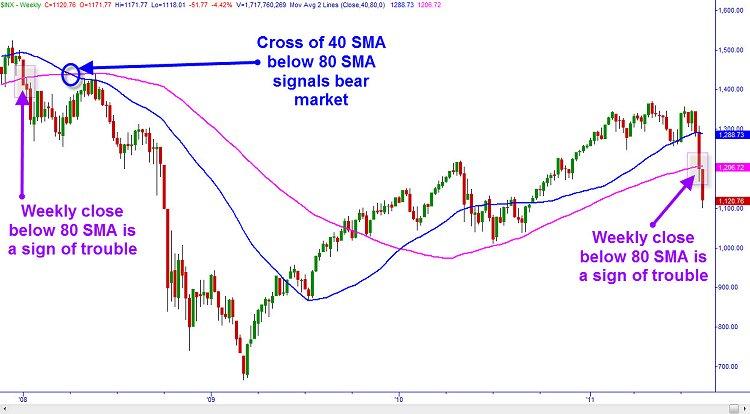
Add to this another startling signal on the S&P 500 index itself and we are in for a rough fall (pun intended). I have previously discussed the 80 week simple moving average as a critical indication of a change in market direction. The SPX has closed below the 80 week SMA on several occasions in the past 20 years after having traded above it for at least a few years. August 17, 1990, April 1, 2004, October 13, 2000, January 4, 2008 are dates when all marked closes below the 80 week SMA and also marked the start of a bearish or sluggish market. We can now add August 5, 2011 to that list of infamous closes.
Is this the start of the double dip recession and another market crash? We will have to wait and see. We may see that QE3 sooner rather than later, but will investors take another spoonful of Ben's medicine or decide that Standard and Poor's is right in their assessment of the US markets? One thing is for sure, the volatility is likely to continue for some time. Rely on your skills learned in your Online Trading Academy courses and stick to your stops.
Author

Brandon Wendell, CMT
Brandon Wendell
Brandon started off in the industry as a retail stockbroker working the phones. With a thirst to learn more about market mechanics, he moved into back-office operations handling order flow as an Agency Desk Operator for a major brokerage.
















