Zcash Price Forecast: ZEC gains 10% to $250 despite geopolitical tensions
- Zcash rises above $250, showing resilience amid heightened market volatility driven by the war in the Middle East.
- Momentum indicators lean bullish, with the RSI above neutral and the MACD reinforcing a clear buy signal.
- Subdued retail participation and a decline in futures Open Interest to $358 million may cap ZEC’s near-term upside.

Zcash (ZEC) is emerging as a standout performer, with its price rising by more than 10% on Tuesday and trading around $250 at the time of writing. ZEC’s notable move comes as broader market sentiment remains shaky, weighed down by escalating geopolitical risk from the Iran war.
Muted retail activity could limit ZEC’s upside
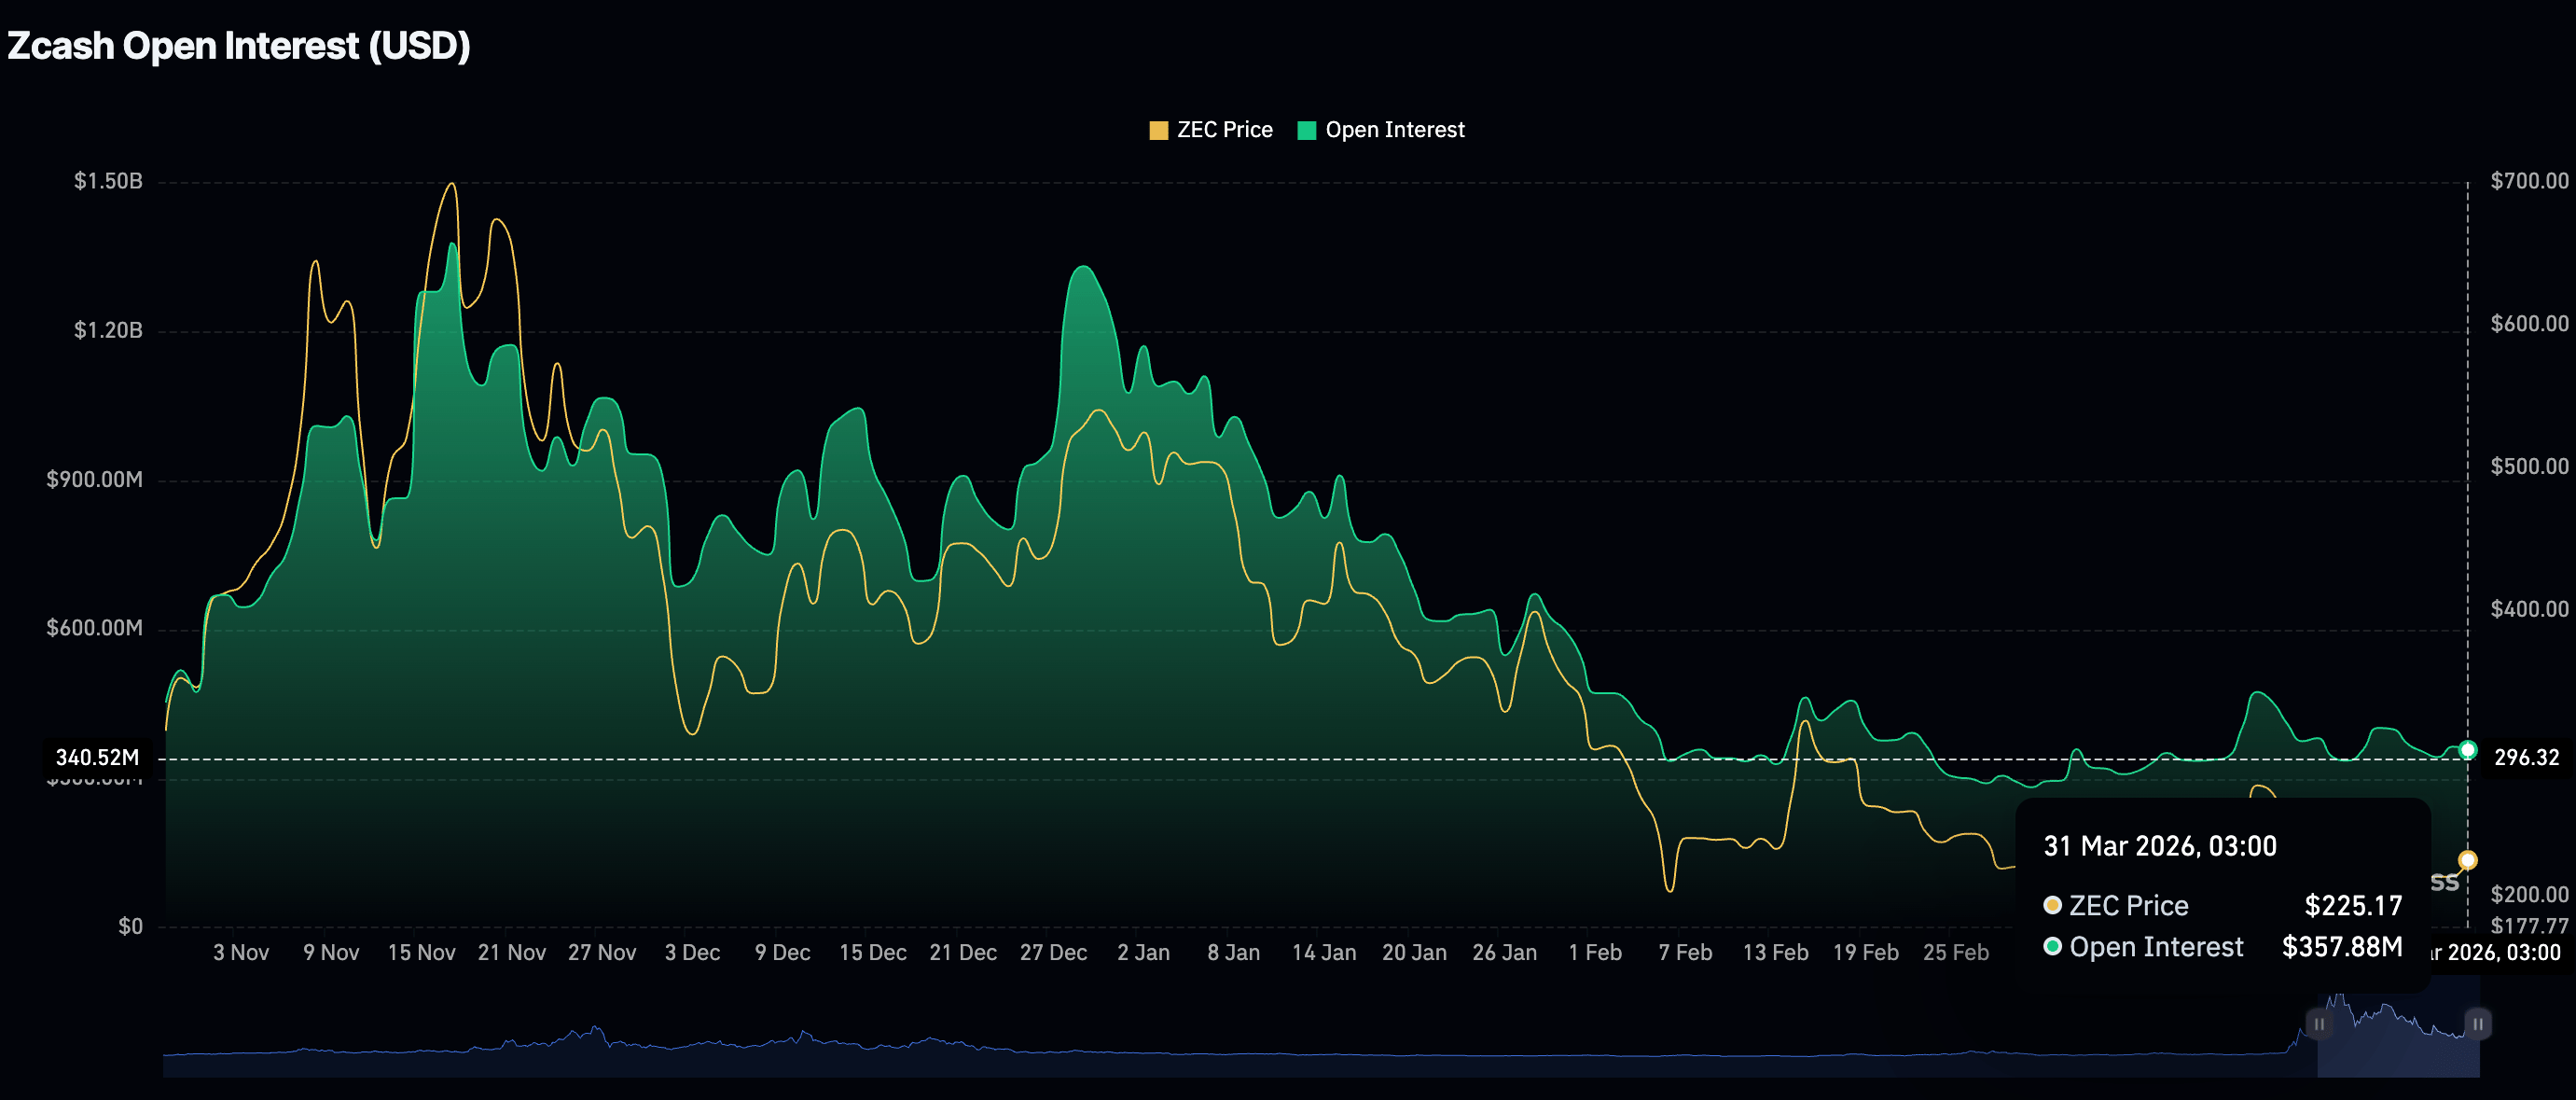
Zcash’s rebound from a daily open of $225 to highs above $250 remains sustained despite low retail activity, as reflected by futures Open Interest (OI) falling to $358 million on Tuesday, from $364 million the previous day.
OI reflects the notional value of outstanding futures, contracts and options, often used to gauge retail interest in the underlying asset. If low OI persists, investor confidence may further deteriorate, limiting Zcash’s recovery potential, as traders will be unwilling to increase their exposure.
Technical outlook: Can Zcash extend its rebound?
Zcash is trading around $250 as the near-term tone skews mildly bullish after reclaiming the prior consolidation highs, with price now pressing above the 50-day Exponential Moving Average (EMA) while the 100-day and 200-day EMAs still cap the broader trend from higher levels.
The Moving Average Convergence Divergence (MACD) green histogram bars have flipped into positive territory, and the MACD is turning higher above the signal line on the daily chart, hinting at improving upside momentum. Similarly, the Relative Strength Index (RSI) around 56 tracks this shift on the same chart, moving out of mid-range and suggesting buyers are gaining short-term control without yet entering overbought conditions.
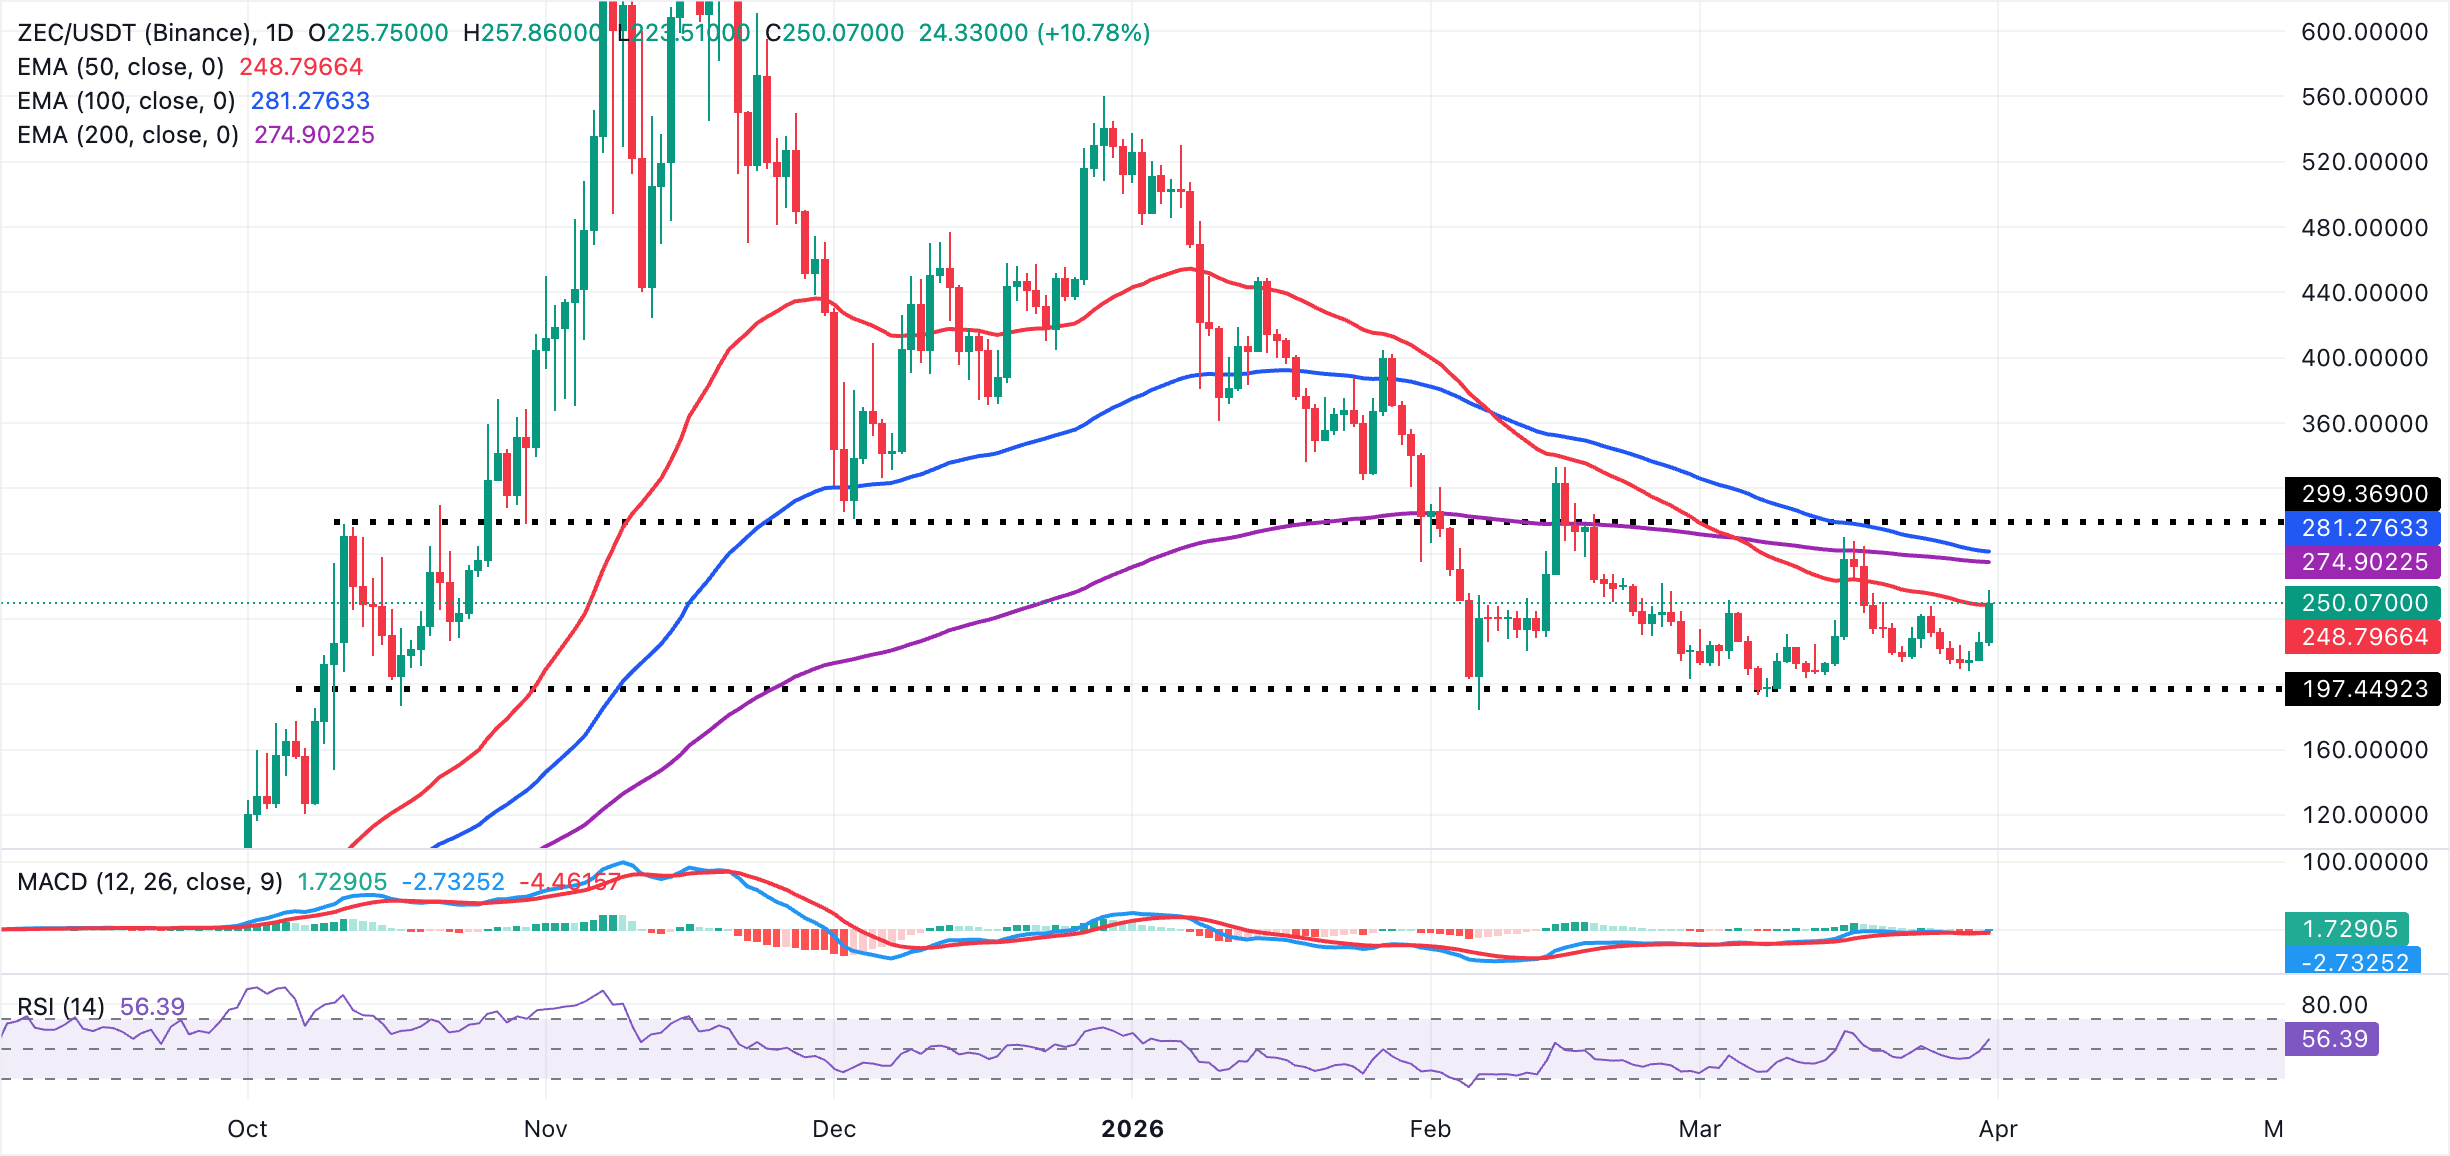
ZEC's immediate support emerges at the 50-day EMA at $249, with a break below exposing the prior cluster of closes around $235 as the next downside level. A deeper pullback would target $225, where recent short-term demand appeared ahead of the broader base toward $215. On the upside, initial resistance aligns with the 200-day EMA around $275, followed by the 100-day EMA at $281, both of which form a key supply zone for the developing recovery. A daily close above this confluence would open the way toward the mid-March swing high near $290 and reinforce the emerging bullish bias.
Open Interest, funding rate FAQs
Higher Open Interest is associated with higher liquidity and new capital inflow to the market. This is considered the equivalent of increase in efficiency and the ongoing trend continues. When Open Interest decreases, it is considered a sign of liquidation in the market, investors are leaving and the overall demand for an asset is on a decline, fueling a bearish sentiment among investors.
Funding fees bridge the difference between spot prices and prices of futures contracts of an asset by increasing liquidation risks faced by traders. A consistently high and positive funding rate implies there is a bullish sentiment among market participants and there is an expectation of a price hike. A consistently negative funding rate for an asset implies a bearish sentiment, indicating that traders expect the cryptocurrency’s price to fall and a bearish trend reversal is likely to occur.
(The technical analysis of this story was written with the help of an AI tool.)
Author

John Isige
FXStreet
John Isige is a seasoned cryptocurrency journalist and markets analyst committed to delivering high-quality, actionable insights tailored to traders, investors, and crypto enthusiasts. He enjoys deep dives into emerging Web3 tren


