XRP falls near key support as ETF inflows try to offset headwinds
- XRP falls for a second consecutive day and tests support around $1.32 as renewed geopolitical tensions weigh.
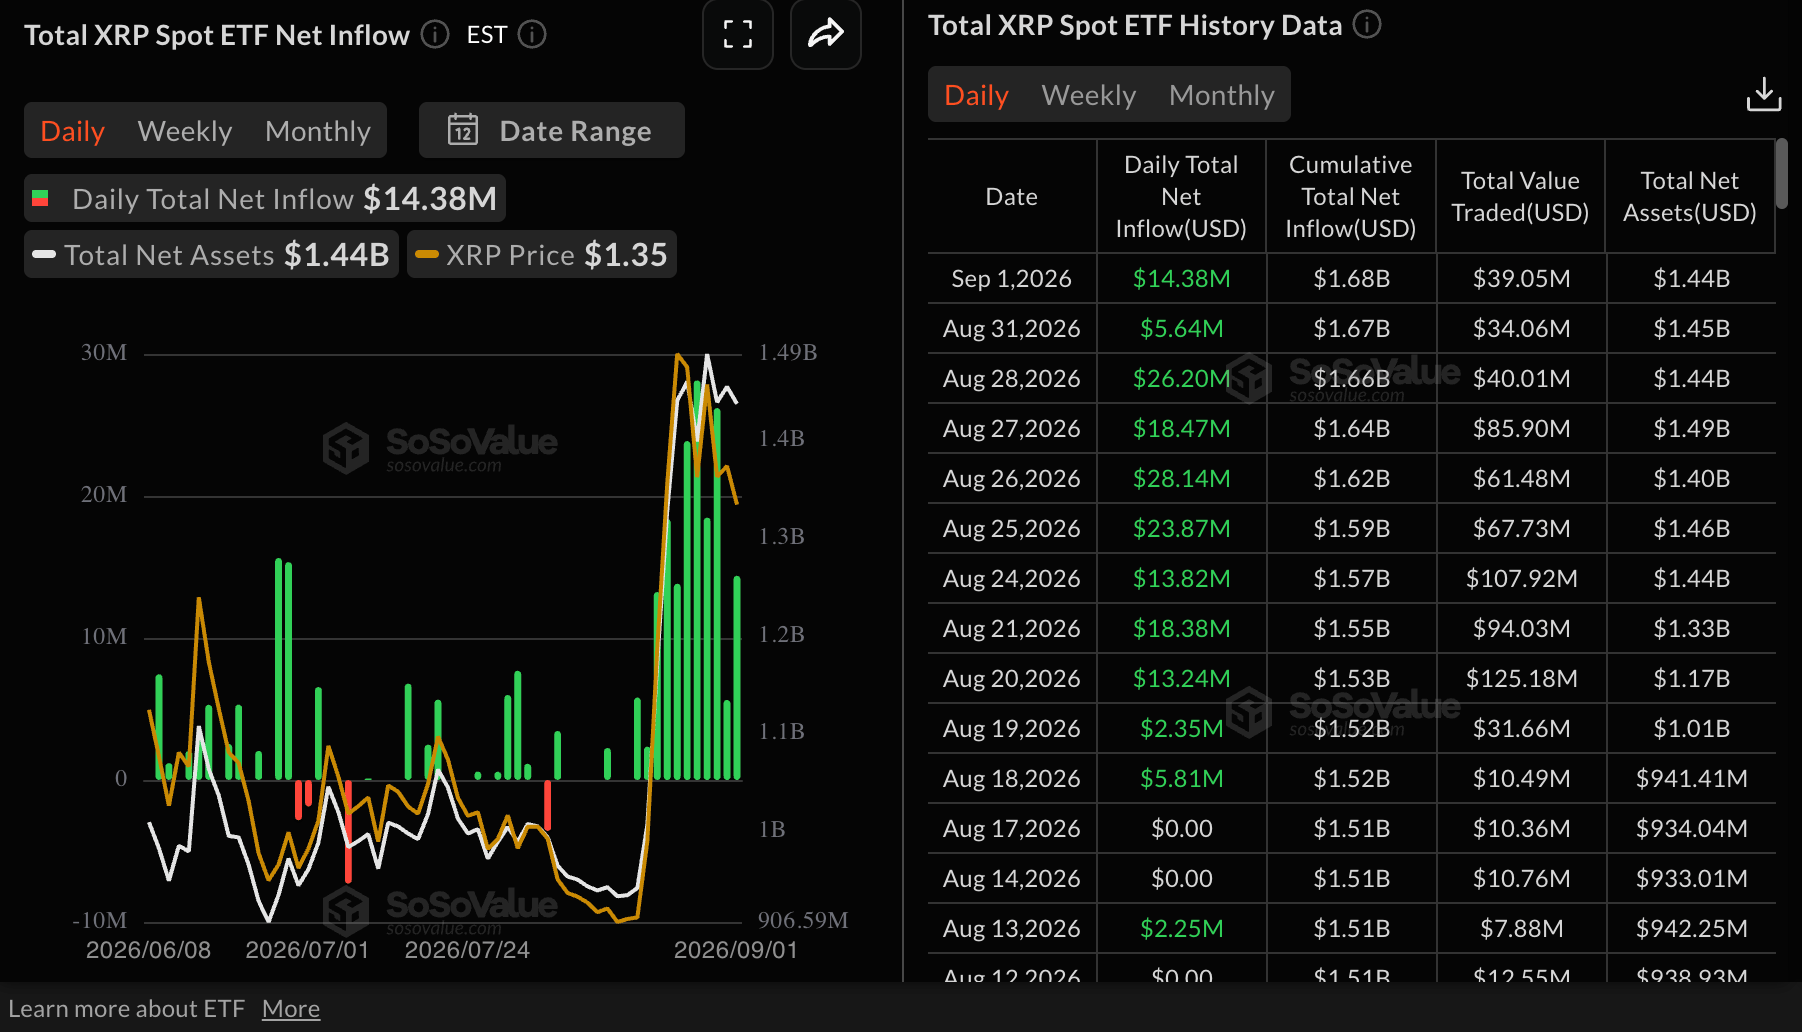
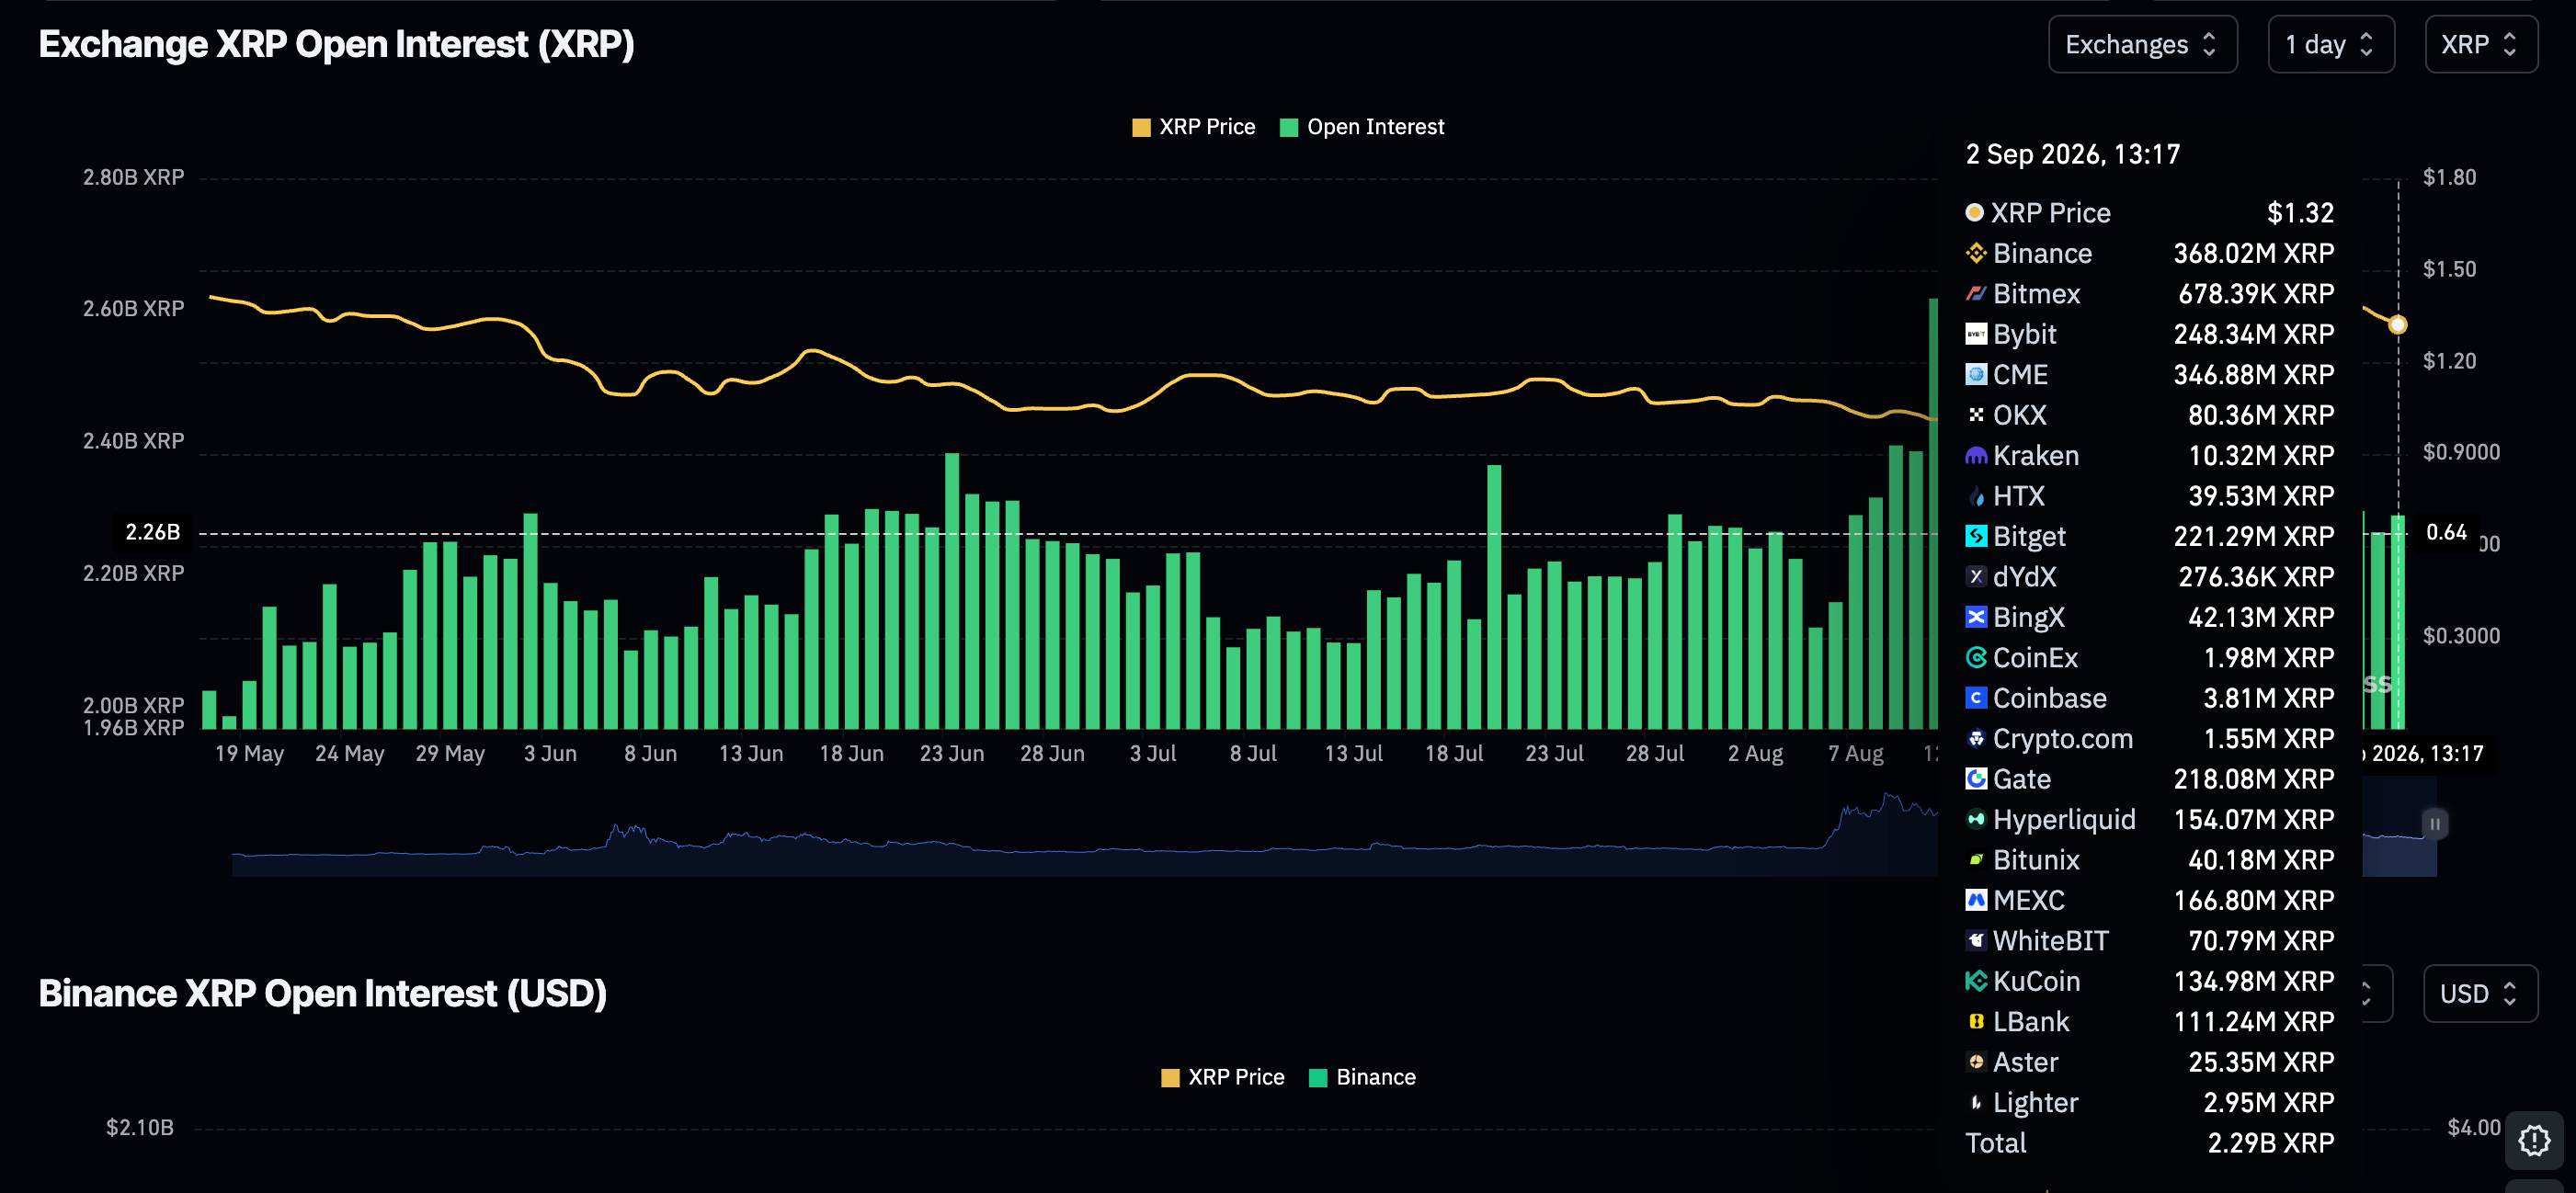
- US-listed spot XRP ETFs recorded $14 million in inflows on Tuesday, while futures Open Interest ticks up.
- XRP comes under pressure as the 200-day EMA flips into resistance and the RSI slides toward the midline.

Ripple (XRP) continues to trim gains on Wednesday, trading around $1.32 at the time of writing. The remittance token came under pressure after a massive 72% rally from $1.00 to $1.70 in August stalled on profit-taking and the need to moderate in search of fresh liquidity.
Renewed geopolitical tensions between the United States (US) and Iran are contributing to the headwinds in the broader cryptocurrency market. Investors are evaluating the impact of strikes between the US and Iran on markets, which has also triggered sell-offs across the board.
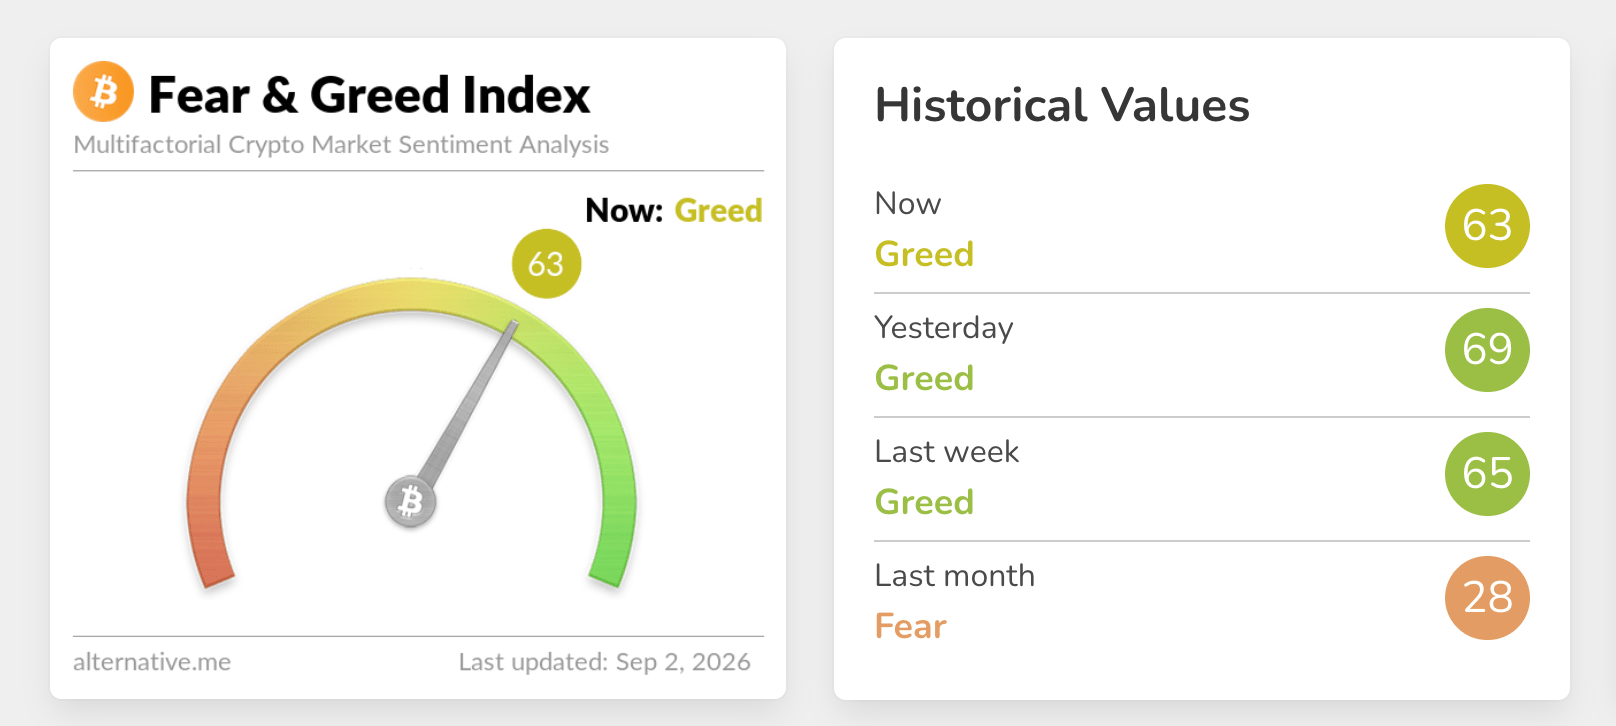
As appetite for risk assets dwindles, the Fear & Greed Index shows sentiment sliding to 63 in the Greed territory on Wednesday, from 69 the previous day. Further deterioration in market sentiment could accelerate XRP’s sell-off below $1.30.
XRP dips as capital inflows remain steady
The pullback in XRP price remains relatively controlled, as capital flowing into digital investment products extends an 11-day bullish streak. According to SoSoValue data, XRP spot ETFs recorded $14 million in inflows on Tuesday, rising from nearly $6 million the day before. Cumulative inflows now stand at $1.68 billion, while net assets average $1.44 billion.
Retail demand through derivatives has climbed marginally to 2.29 billion XRP on Wednesday, from 2.26 billion the previous day. This minor increase in perpetual futures Open Interest (OI) comes against a backdrop of a spike to 2.78 billion XRP on August 15, the highest level since October. The surge coincided with the rally to $1.70 on August 22; hence, any increase in OI could back a sustained recovery.
Technical analysis: XRP sell-off deepens
XRP trades at $1.32, keeping a soft bearish bias as it holds below the 200-day Exponential Moving Average (EMA) at $1.35 and the long-standing downward resistance trendline that broke near $1.40. The pair, however, still trades above the clustered 50-day and 100-day EMAs just under $1.22, suggesting that while the broader trend remains capped by overhead supply, the underlying structure retains some support.
The Relative Strength Index (RSI) near 55 hints at modest, fading bullish momentum, while the Moving Average Convergence Divergence (MACD) has slipped back into negative territory, reinforcing the idea of a corrective pullback within a still-constrained market.
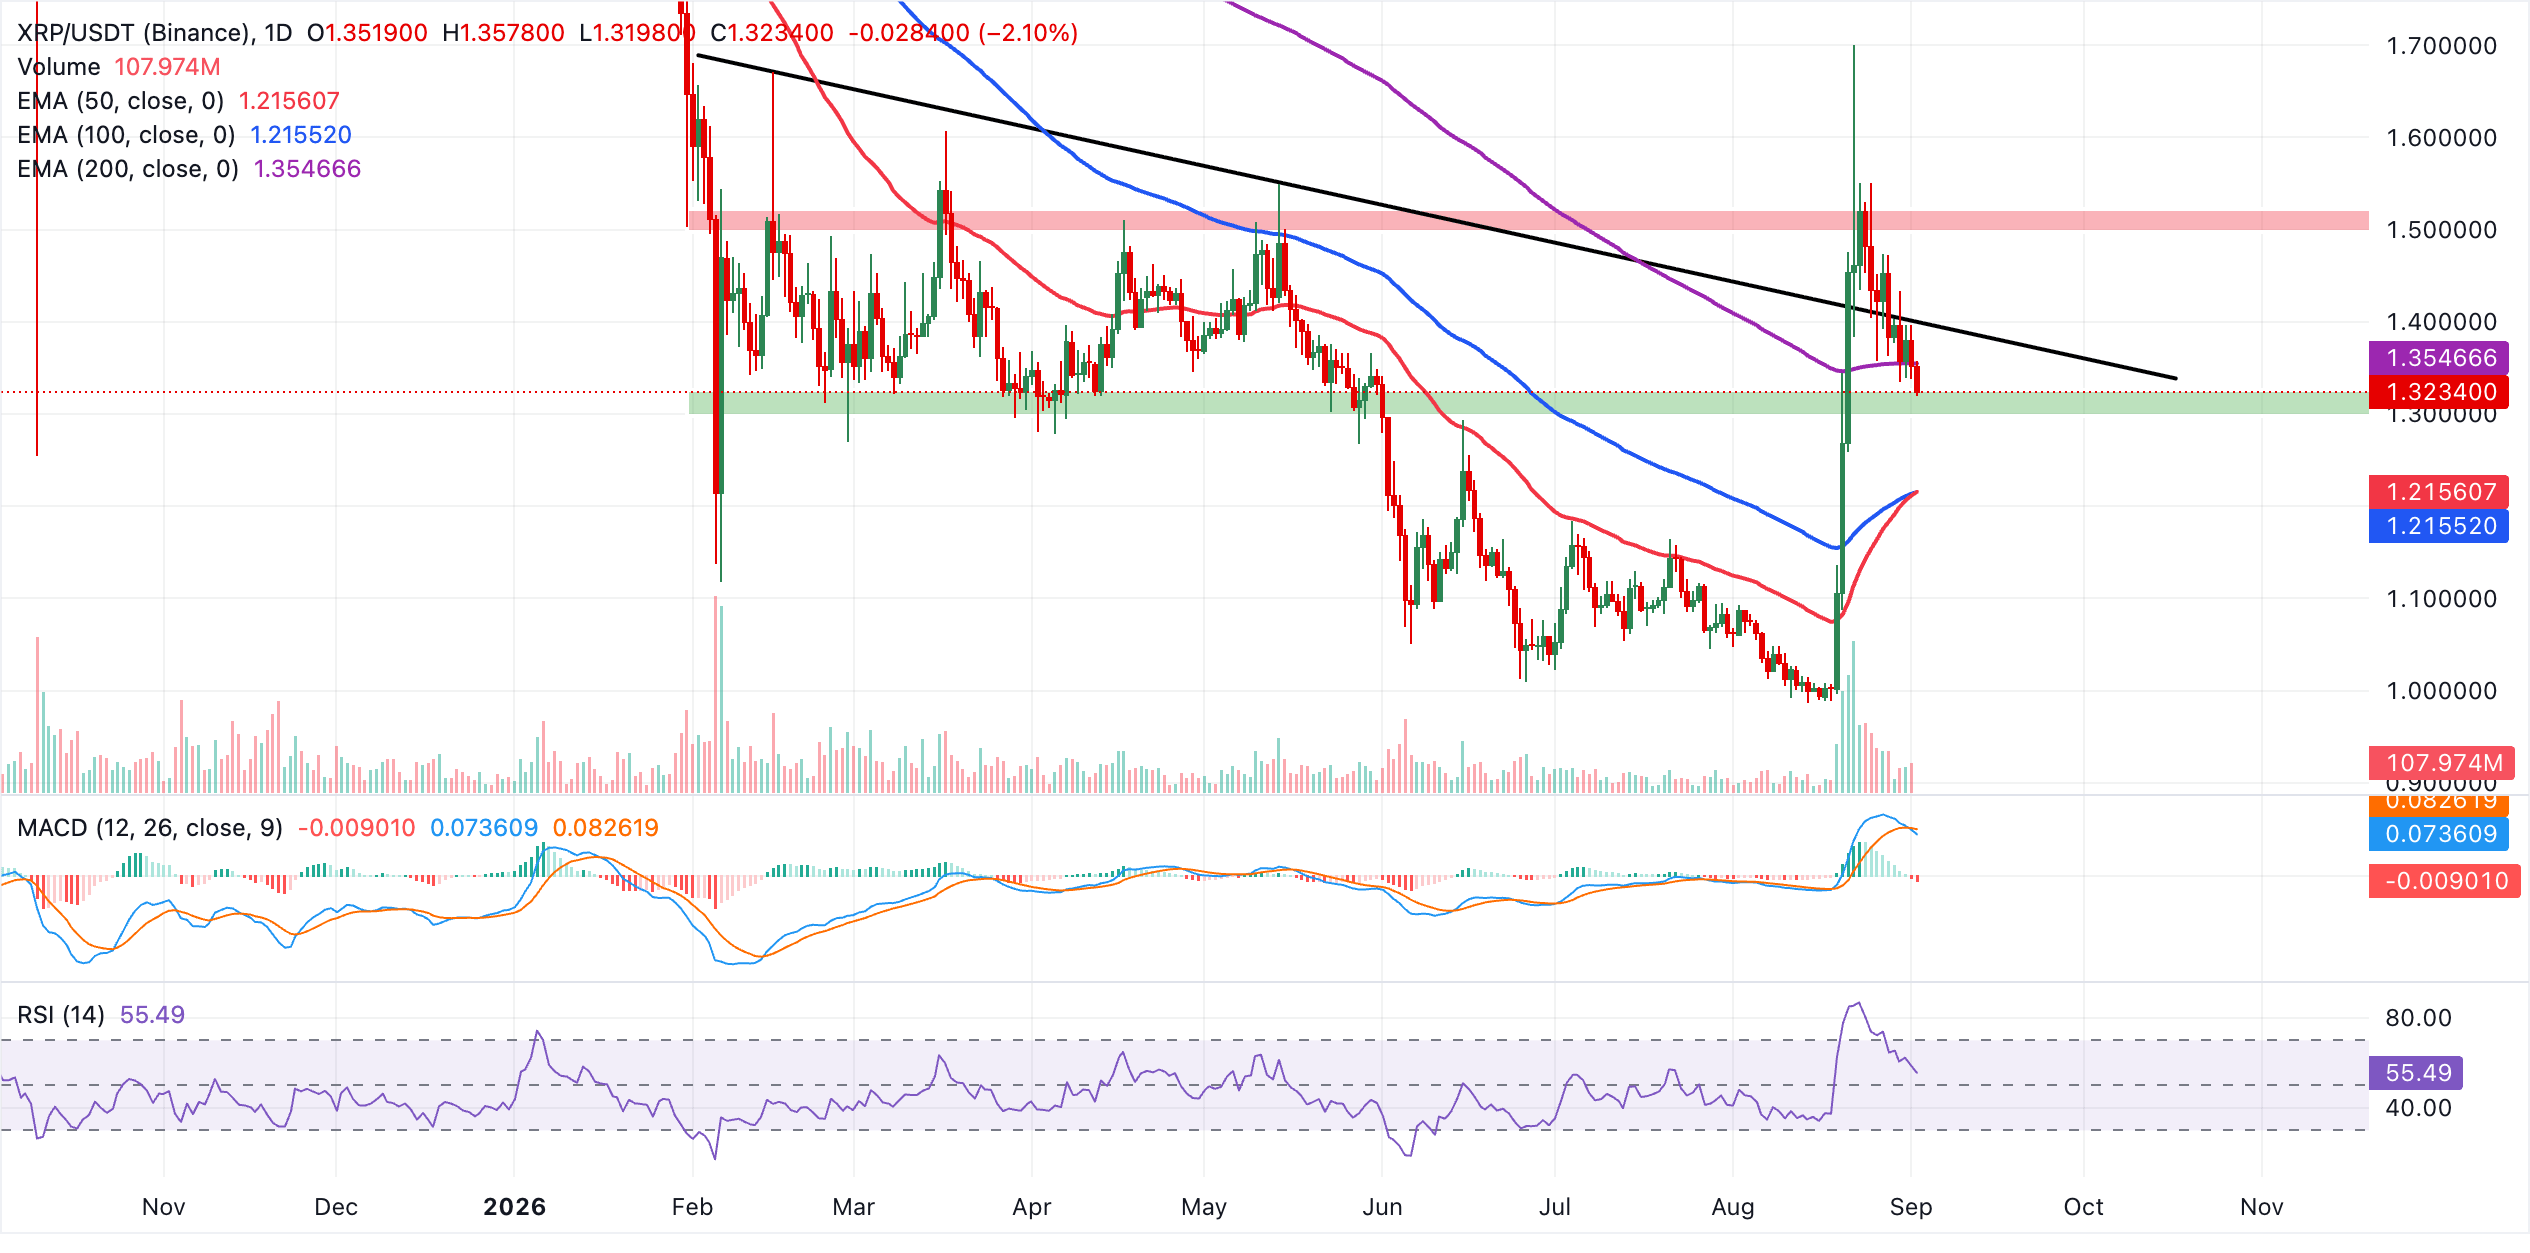
On the topside, immediate resistance is seen at the 200-day EMA around $1.35, with the next, stronger barrier at the reclaimed downward resistance trendline near $1.40, a zone that would need to give way to ease the broader bearish cap. On the downside, initial support appears at the tight 50-day EMA cluster around $1.22, coinciding with the 100-day EMA. A daily close below this band would expose XRP to a deeper slide and signal that buyers are losing control of the current corrective structure.
(The technical analysis of this story was written with the help of an AI tool. Know more.)
Cryptocurrency prices FAQs
Token launches influence demand and adoption among market participants. Listings on crypto exchanges deepen the liquidity for an asset and add new participants to an asset’s network. This is typically bullish for a digital asset.
A hack is an event in which an attacker captures a large volume of the asset from a DeFi bridge or hot wallet of an exchange or any other crypto platform via exploits, bugs or other methods. The exploiter then transfers these tokens out of the exchange platforms to ultimately sell or swap the assets for other cryptocurrencies or stablecoins. Such events often involve an en masse panic triggering a sell-off in the affected assets.
Macroeconomic events like the US Federal Reserve’s decision on interest rates influence crypto assets mainly through the direct impact they have on the US Dollar. An increase in interest rate typically negatively influences Bitcoin and altcoin prices, and vice versa. If the US Dollar index declines, risk assets and associated leverage for trading gets cheaper, in turn driving crypto prices higher.
Halvings are typically considered bullish events as they slash the block reward in half for miners, constricting the supply of the asset. At consistent demand if the supply reduces, the asset’s price climbs.
Author

John Isige
FXStreet
John Isige is a seasoned cryptocurrency journalist and markets analyst committed to delivering high-quality, actionable insights tailored to traders, investors, and crypto enthusiasts. He enjoys deep dives into emerging Web3 tren