Vechain Elliott Wave technical analysis [Video]
![Vechain Elliott Wave technical analysis [Video]](https://editorial.fxstreet.com/images/Markets/Currencies/Cryptocurrencies/cryptocurrenciesusd.jpg)
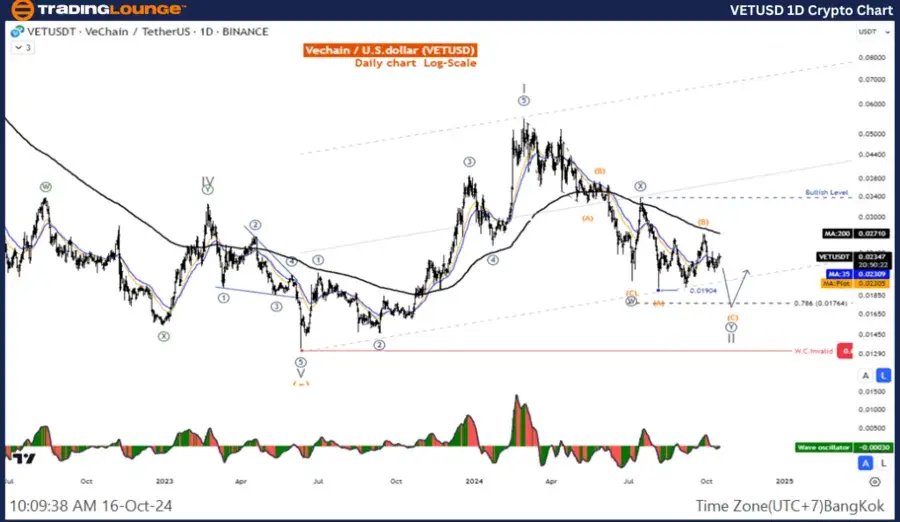
Elliott Wave Analysis TradingLounge Daily Chart,
Vechain/ U.S. dollar(VETUSD).
VETUSD Elliott Wave technical analysis
Function: Counter trend.
Mode: Corrective.
Structure: Double Corrective.
Position: Wave ((Y)).
Direction next higher degrees: Wave II of Impulse.
Wave cancel invalid level:
Details: Wave II may not be complete, price is likely to be below 0.01781.
Vechain/U.S. dollar(VETUSD)Trading Strategy:
This is a Five-wave retracement of wave (C), where we are in the final stages of wave Y, which is likely to test the 0.017 level, so the overall picture is a short-term retracement before another rally.
Vechain/U.S. dollar(VETUSD)Technical Indicators: The price is below the MA200 indicating a Downtrend, The Wave Oscillator is a Bearish Momentum.
Vechain/ U.S. dollar(VETUSD).
VETUSD Elliott Wave technical analysis
Function: Counter trend.
Mode: Corrective.
Structure: Double Corrective.
Position: Wave ((Y)).
Direction next higher degrees: Wave II of Impulse.
Wave cancel invalid level:
Details: Wave II may not be complete, price is likely to be below 0.01781.
Vechain/ U.S. dollar(VETUSD)Trading Strategy:
This is a Five-wave retracement of wave (C), where we are in the final stages of wave Y, which is likely to test the 0.017 level, so the overall picture is a short-term retracement before another rally.
Vechain/ U.S. dollar(VETUSD)Technical Indicators: The price is below the MA200 indicating a Downtrend, The Wave Oscillator is a Bearish Momentum.
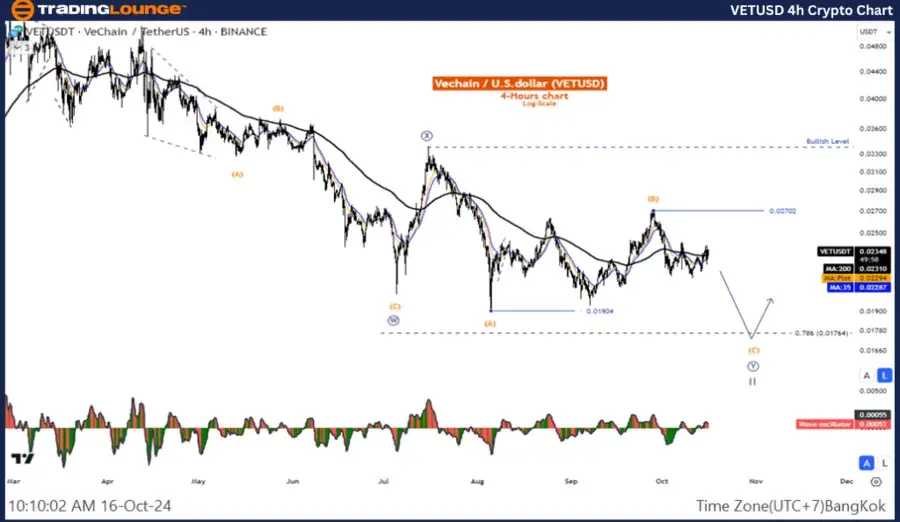
Technical analyst: Kittiampon Somboonsod.
VETUSD Elliott Wave technical analysis [Video]
Author

Peter Mathers
TradingLounge
Peter Mathers started actively trading in 1982. He began his career at Hoei and Shoin, a Japanese futures trading company.


