Top Altcoins Price Forecast: XRP, ADA, and SOL are vulnerable to deeper losses
- Ripple edges lower on Tuesday, extending its 4% decline from the previous day.
- Cardano holds steady after a 6% drop the previous day, marking the breakout of a short-term rising support trendline.
- Solana extends losses following a 3% drop below its 50-day EMA at $76.32 on Monday.

The top altcoins, including Ripple (XRP), Cardano (ADA) and Solana (SOL), are trading in the red as the broader cryptocurrency market faces downside pressure. The bearish pressure aligns with Citadel Securities' anticipation of a surprise Fed rate hike, which could reduce liquidity in high-risk assets, including crypto assets.
Technical outlook: XRP, ADA and SOL risk further decline
XRP extends a steady decline below its 50-day Exponential Moving Average (EMA) at $1.1337. At the time of writing, XRP edges lower on Tuesday, extending its 4% decline from the previous day.
From a technical perspective, XRP trades below the 78.6% Fibonacci retracement level, measured from $1.2935 to $1.009, at $1.0700. The next bullish defense aligns with the Fibonacci anchor at $1.009.
Momentum reflects reinforcing downside pressure with the Relative Strength Index (RSI) at 39 sloping below the neutral 50 line, while the Moving Average Convergence Divergence (MACD) holds marginally below its signal line in the negative territory. Together, the indicators suggest waning bullish momentum rather than an imminent reversal.
On the topside, initial resistance appears at the 78.6% Fibonacci retracement at $1.0700, followed by the 50-day EMA at $1.1337 and the 50% retracement at $1.1513.
Cardano maintains a steady downward trend below its 50-day EMA at $0.1739 amid a broader bearish backdrop. Recent rebounds remain corrective within a dominant downtrend and extend the decline below the broken rising support trendline near $0.1673.
The bearish breakout in ADA could target the June 6 low at $0.1486, followed by the June 26 swing low at $0.1385.
Momentum conditions align with a bearish tone, with the RSI near 39 signaling weak demand, while the MACD and signal line have slipped marginally into negative territory, suggesting sellers still retain the upper hand.
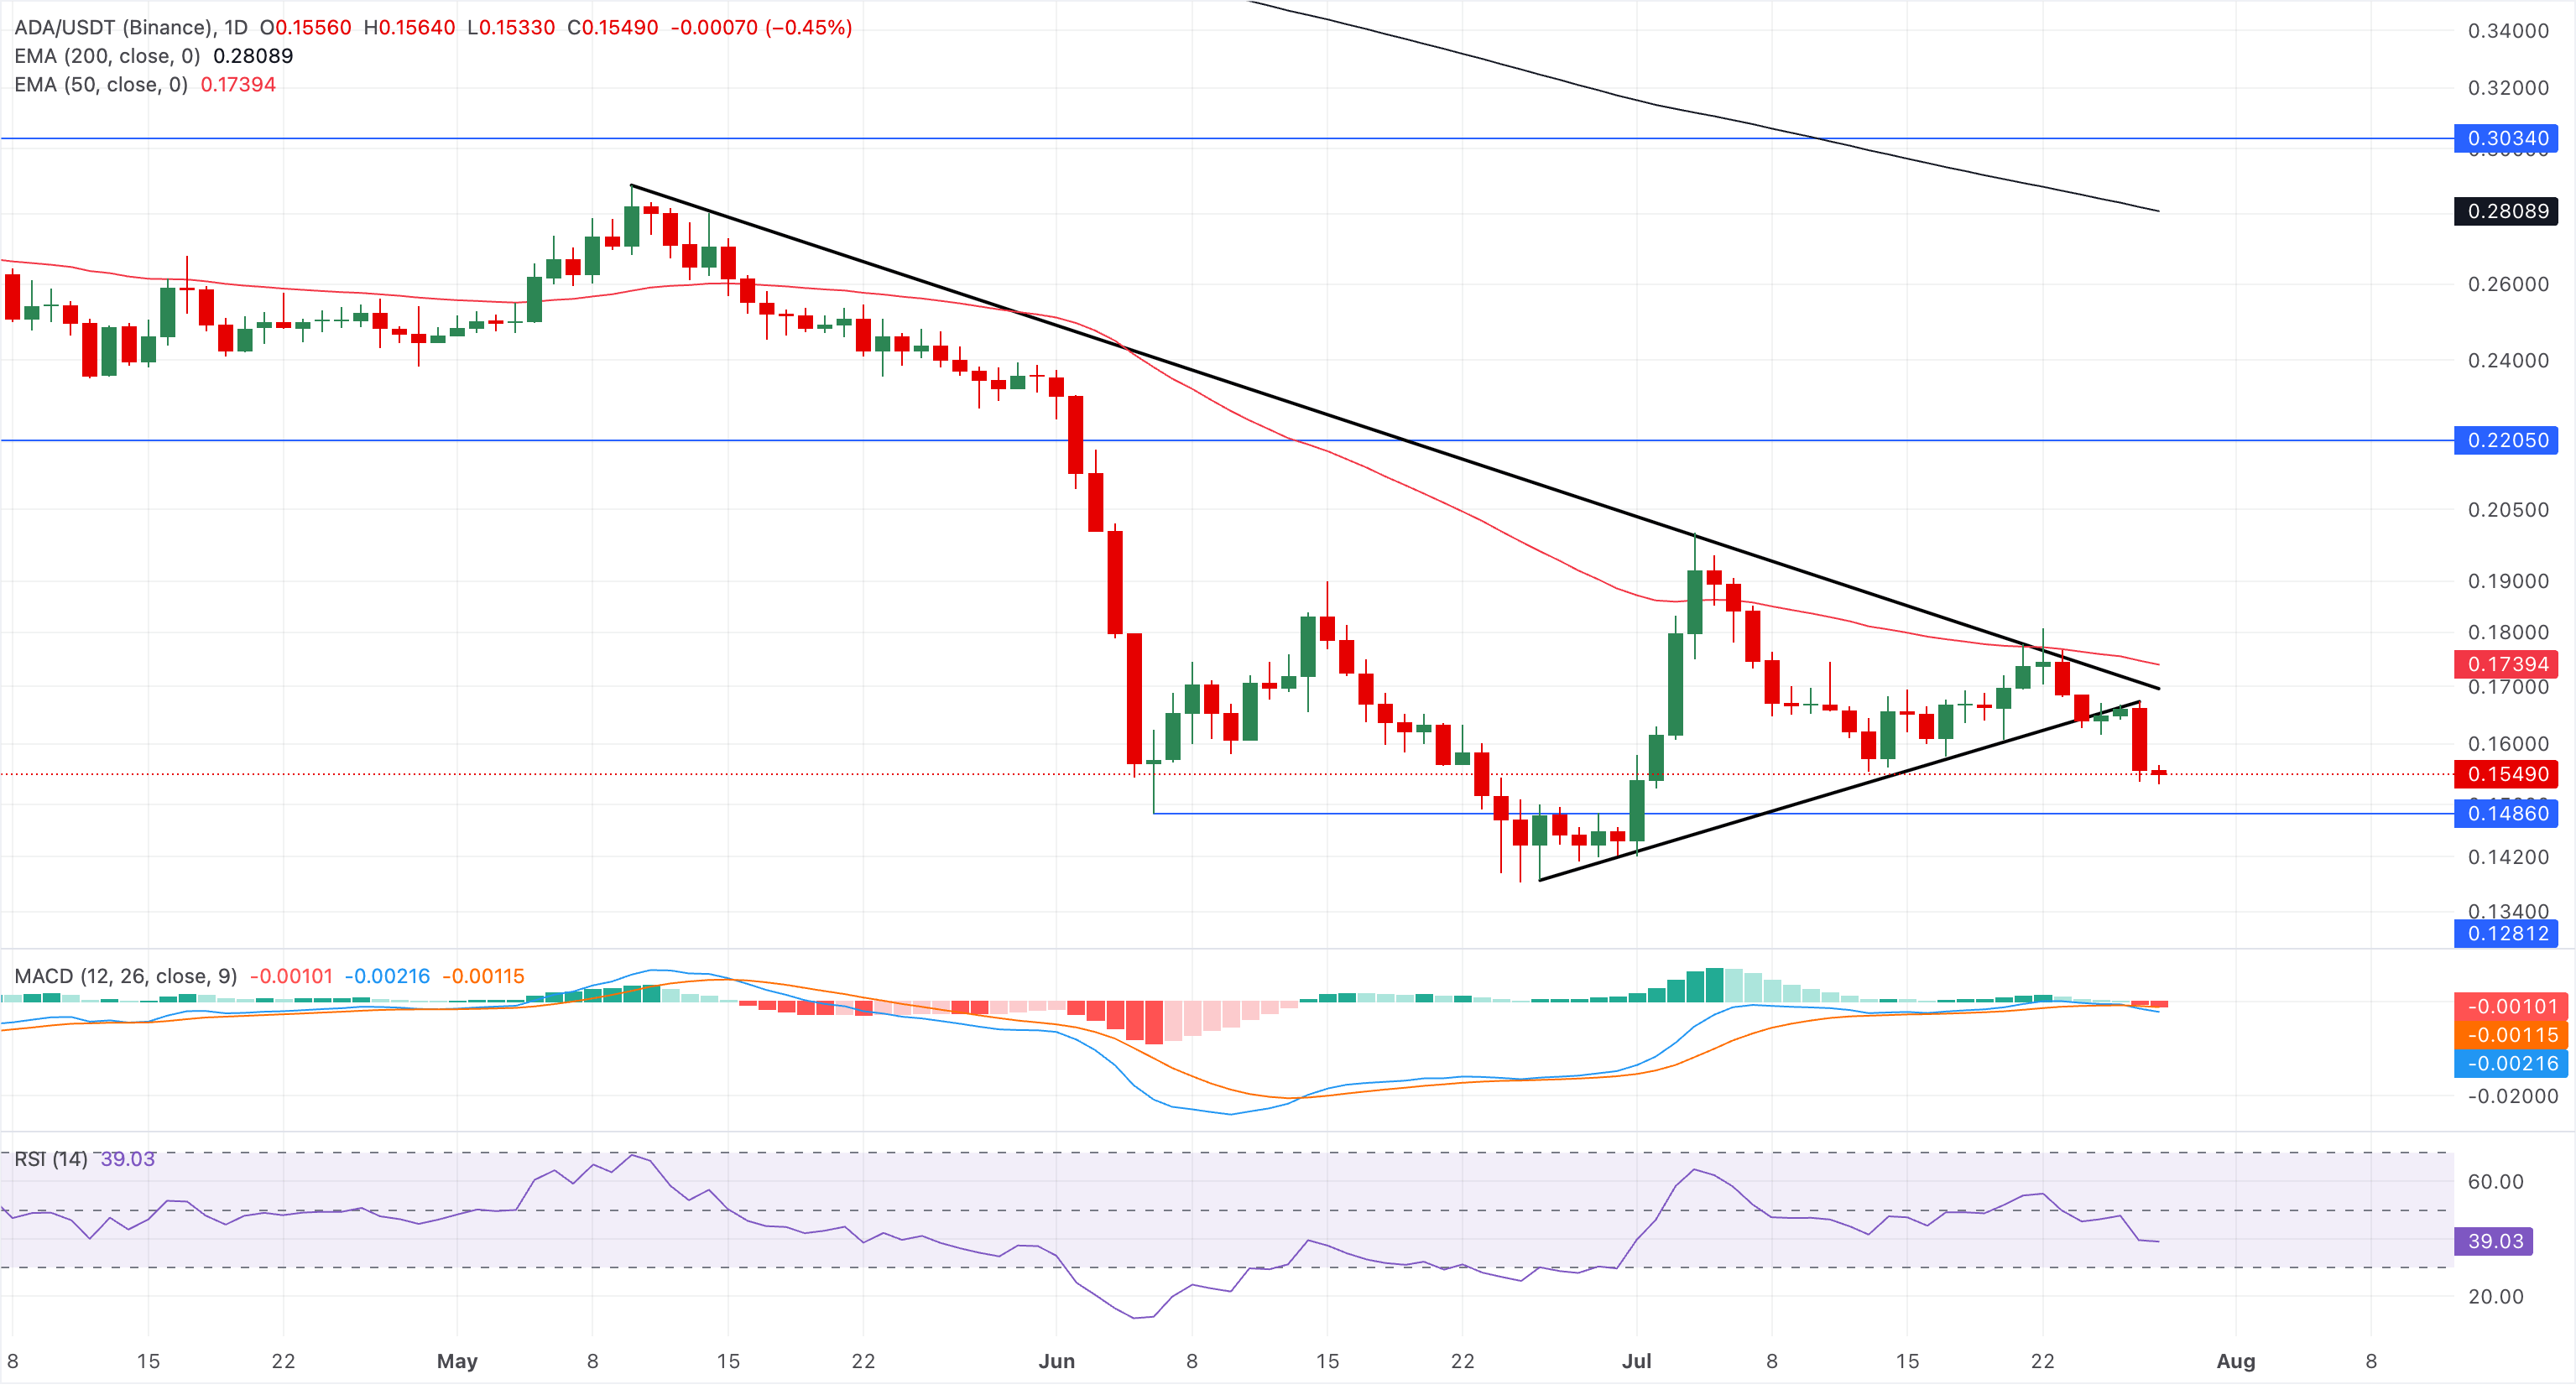
Initial resistance appears around the former rising support level of $0.1673, forming a cap zone. A sustained break above this area would then bring the 50-day EMA at $0.1739 into focus as the next hurdle before the much higher 200-day EMA at $0.2808.
Solana trades below $75 on Tuesday, maintaining a bearish near-term bias below the 50-day EMA at $76.32 and well under the 200-day EMA at $92.59. From a technical perspective, the overhead moving averages keep rallies capped by layered overhead supply.
Momentum reinforces this soft tone, with the RSI at around 42, indicating weak demand, while the MACD remains in negative territory and below its signal line, suggesting downside pressure is still dominant.
A steady decline in SOL could target the February 6 low at $67.50, followed by the June 6 low at $60.13.
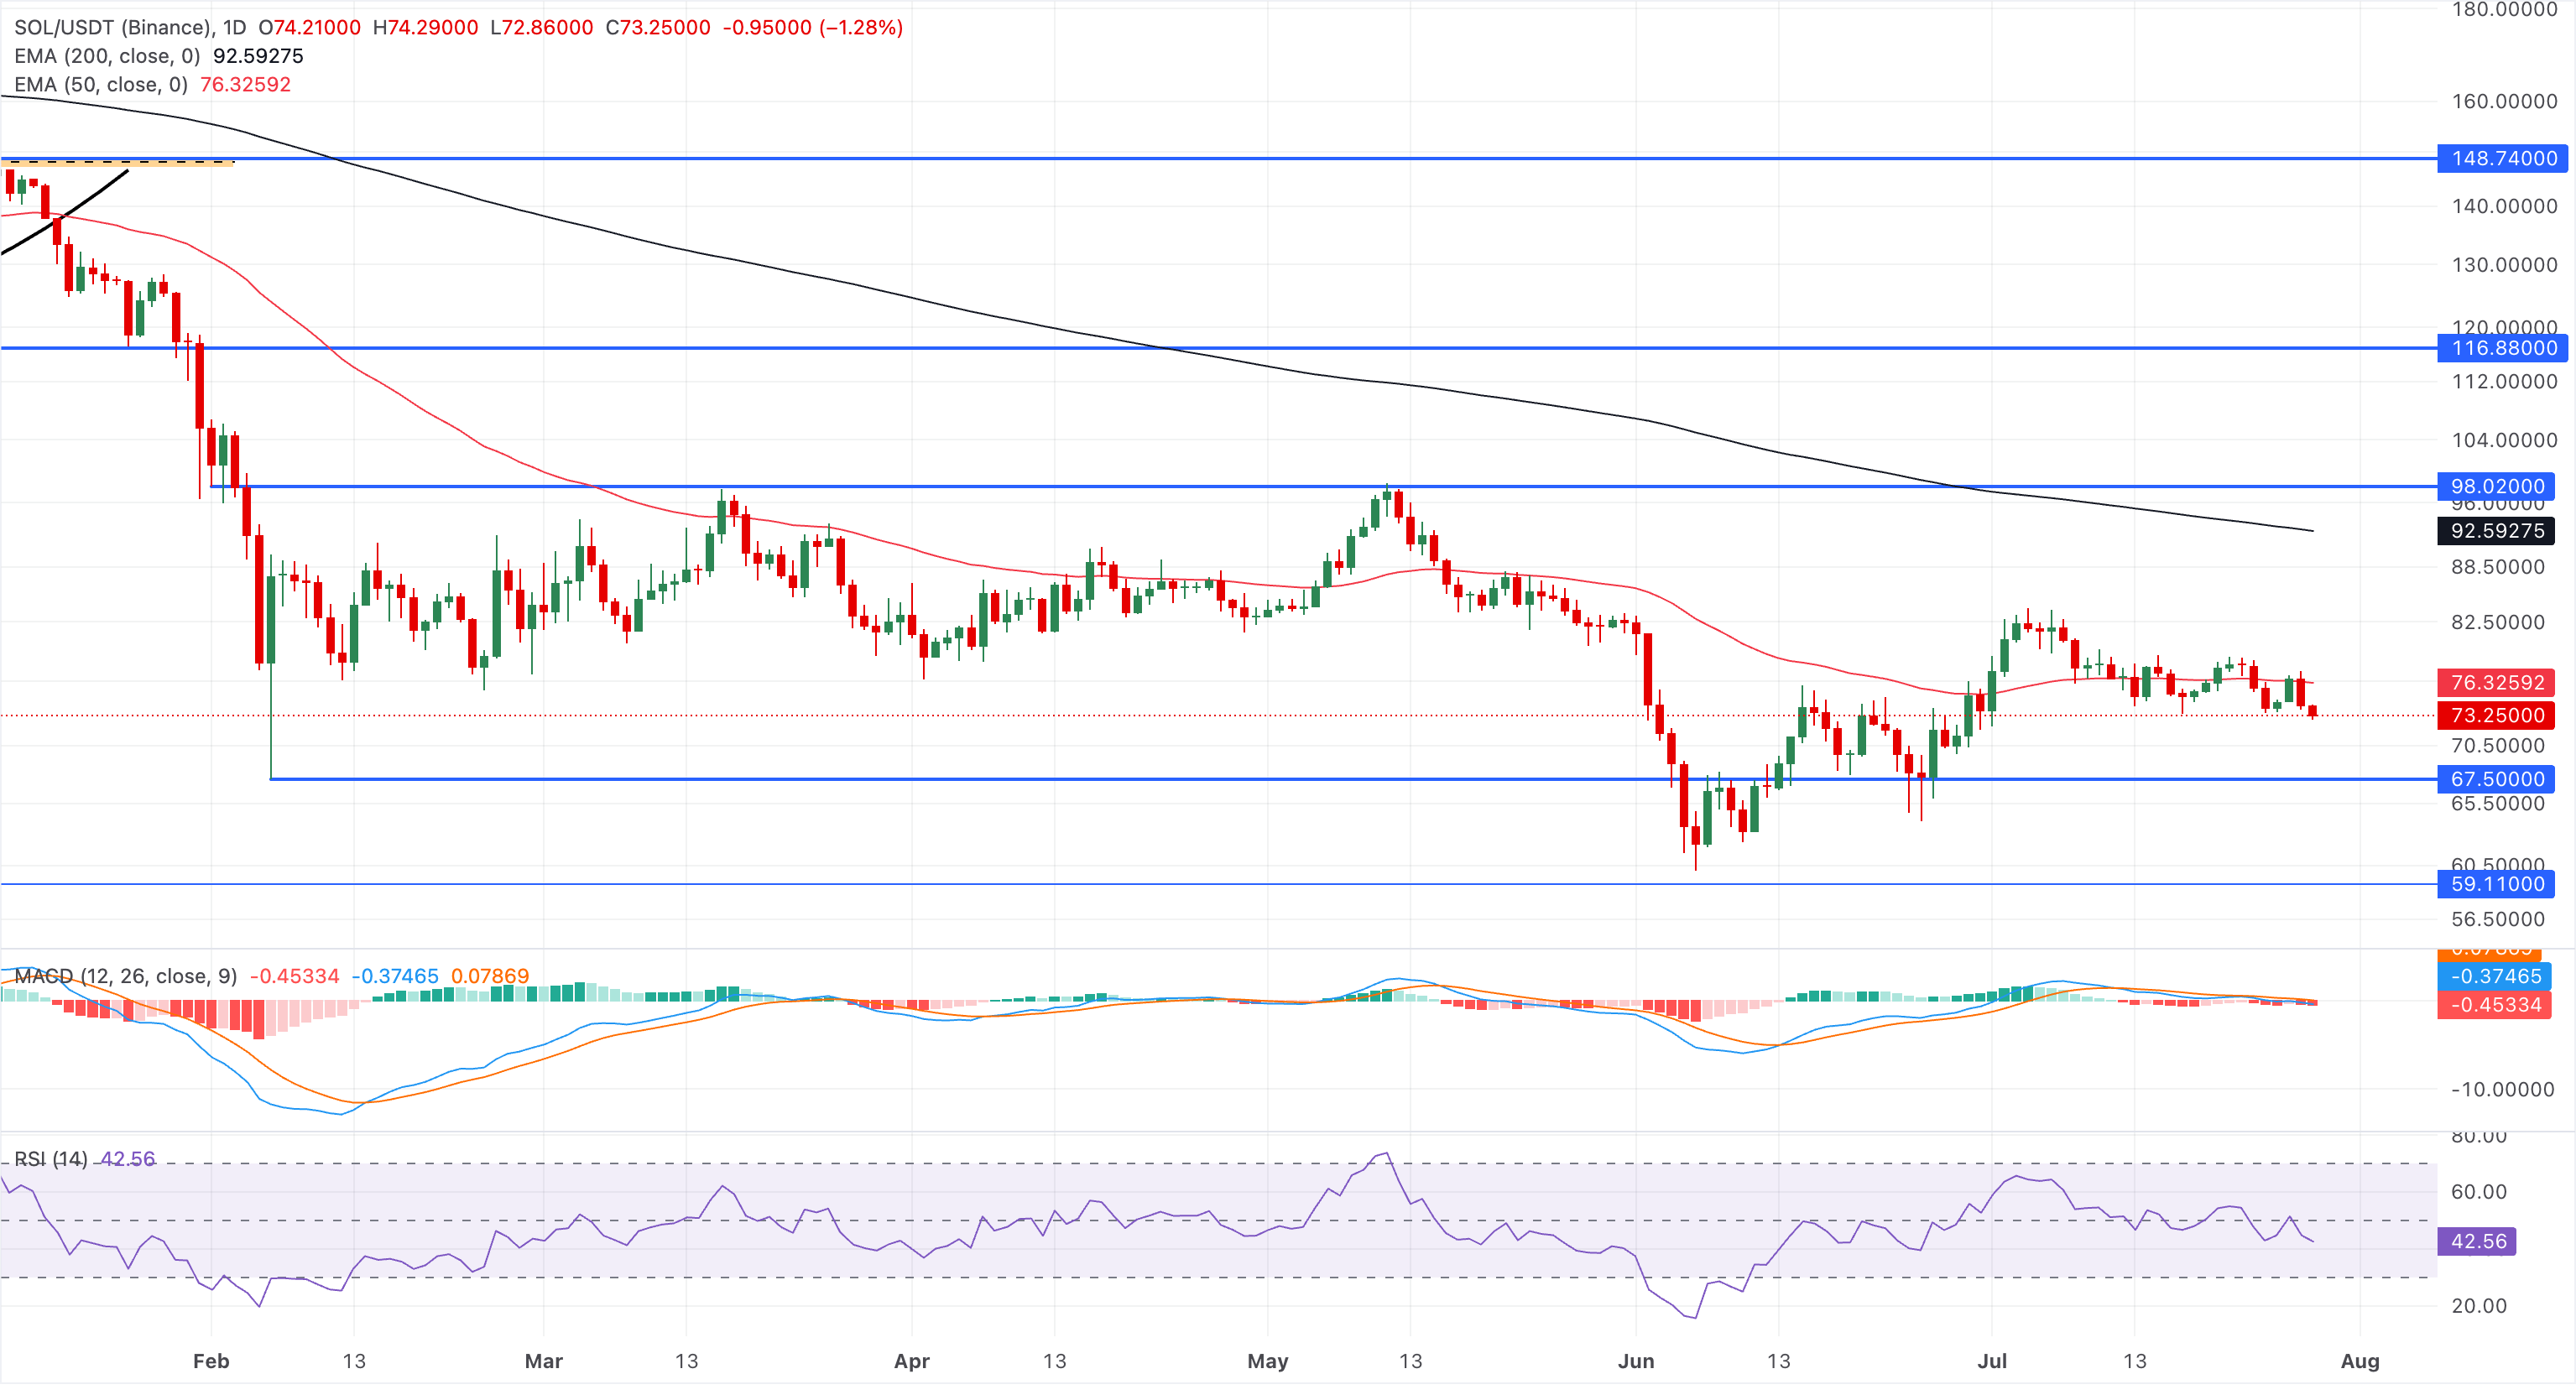
On the topside, initial resistance is at the 50-day EMA near $76.32, where any recovery is likely to encounter the first meaningful selling pressure. A sustained break above that zone would expose the 200-day EMA at $92.59 as the next key barrier.
(The technical analysis of this story was written with the help of an AI tool. Know more.)
Author

Vishal Dixit
FXStreet
Vishal Dixit holds a B.Sc. in Chemistry from Wilson College but found his true calling in the world of crypto.



