Top 3 Price Predictions: Bitcoin braces for critical support, Ethereum may endure before edging up, Ripple rout, no end in sight – Confluence Detector
- Bitcoin, Ethereum, and Ripple suffer another major sell-off, extending their falls.
- The three cryptocurrencies have very different technical pictures.
- The Confluence Detector shows clusters of technical levels according to their importance.

BTC/USD has strong support at $6,381
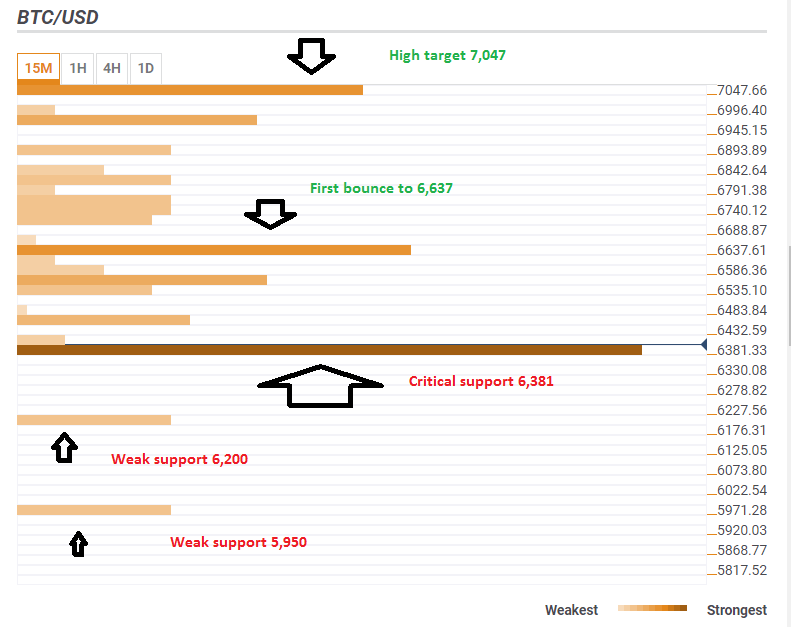
The price of Bitcoin has support at $6,381. This is the convergence of the Bolinger Band one-hour Lower, the Pivot Point one month Support 1, the Pivot Point one-day Support 1 and the 1h-low.
If BTC/USD holds onto this critical level, it could target $6,637 which is the confluence of the Fibonacci 38.2% one-day, the 4h-high, the Simple Moving Average 100-15m, and the Bolinger Band 15m-Upper.
The next level above is $7047 which is the one-month low.
And what happens if Bitcoin loses $6,381? Things could get ugly with some support at $6,200 and $5,950.
This is how it looks:
ETH/USD has more room to fall, but support awaits
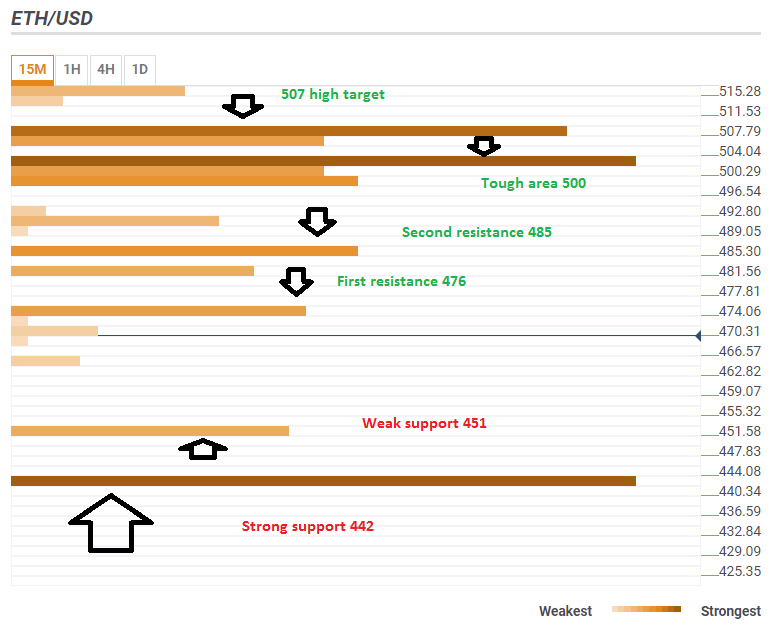
The Ethereum Price does not have immediate support. ETH/USD may fall to a weak support line of $451 which is the Pivot Point one-day Support 2. Yet stronger support is at $442 which is the Pivot Point one-month Support 1.
Recovering will not be so easy. The $476 level is the convergence of the Pivot Point one-day Support 1 and the Simple Moving Average 5-15m. Stronger resistance is at $485 which is the meeting point of the 1d-high and the Simple moving Average 5-1h.
Further above, the $500 area is the congestion of the Fibonacci 23.6% one-day, the Bolinger Band 1h-Middle, the SMA 5-4h, and the one-month low. It is closely followed by $507 which is the congestion of the Simple Moving Average 100-15m, the Fibonacci 38.2% one-day, the Bolinger Band 15m-Upper, and the Bollinger Band one-day Lower.
Here is how it looks:
XRP/USD can fall and fall
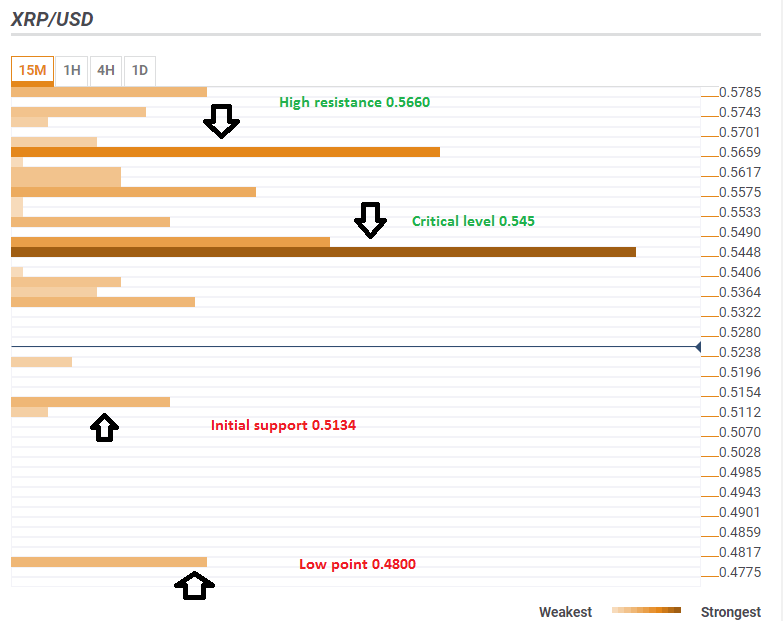
The price of Ripple.is in a precarious state. It has lost critical support at $0.545 which is the confluence of the one-day high, the one-month low, the Bolinger Band one-day Lower, the Simple Moving Average 10-15m, the SMA 5-1h and more.
Looking down, there is some support around $0.5134 which is the Pivot Point one-day Support 2. Another notable line is 0.4800 which is the Pivot Point one-day Support 1.
On the upside, if XRP/USD recovers above $0.545, the next level to watch is $0.566 which is the Fibonacci 38.2% one-day, the Pivot Point one-week Support 3, and the Bolinger Band 15m-Upper.
This is how it looks:
The Confluence Detector finds exciting opportunities using Technical Confluences. The TC is a tool to locate and point out those price levels where there is a congestion of indicators, moving averages, Fibonacci levels, Pivot Points, etc. Knowing where these congestion points are located is very useful for the trader, and can be used as a basis for different strategies.
This tool assigns a certain amount of “weight” to each indicator, and this “weight” can influence adjacents price levels. These weightings mean that one price level without any indicator or moving average but under the influence of two “strongly weighted” levels accumulate more resistance than their neighbors. In these cases, the tool signals resistance in apparently empty areas.
Author

Yohay Elam
FXStreet
Yohay is in Forex since 2008 when he founded Forex Crunch, a blog crafted in his free time that turned into a fully-fledged currency website later sold to Finixio.



