Top 3 Price Prediction: Bitcoin, Ethereum, Ripple – BTC, ETH and XRP pause as momentum indicators signal overbought conditions, massive rallies
- Bitcoin trades around $77,000 on Monday, with a bullish bias but appearing stretched after surging 23.58% last week.
- Ethereum momentum indicators signal strong overbought conditions after a 31.31% surge last week, suggesting a pause.
- XRP trades around $1.48 on Monday after skyrocketing 53.02% last week.

Bitcoin (BTC), Ethereum (ETH) and Ripple (XRP) hover around key levels on Monday, with a bullish bias but appearing stretched after surging over 23%, 31% and 53% in the previous week. Such a massive rally suggests the top three cryptocurrencies could consolidate or pull back in the short term as traders take profits.
Bitcoin’s risk of a corrective pause is rising
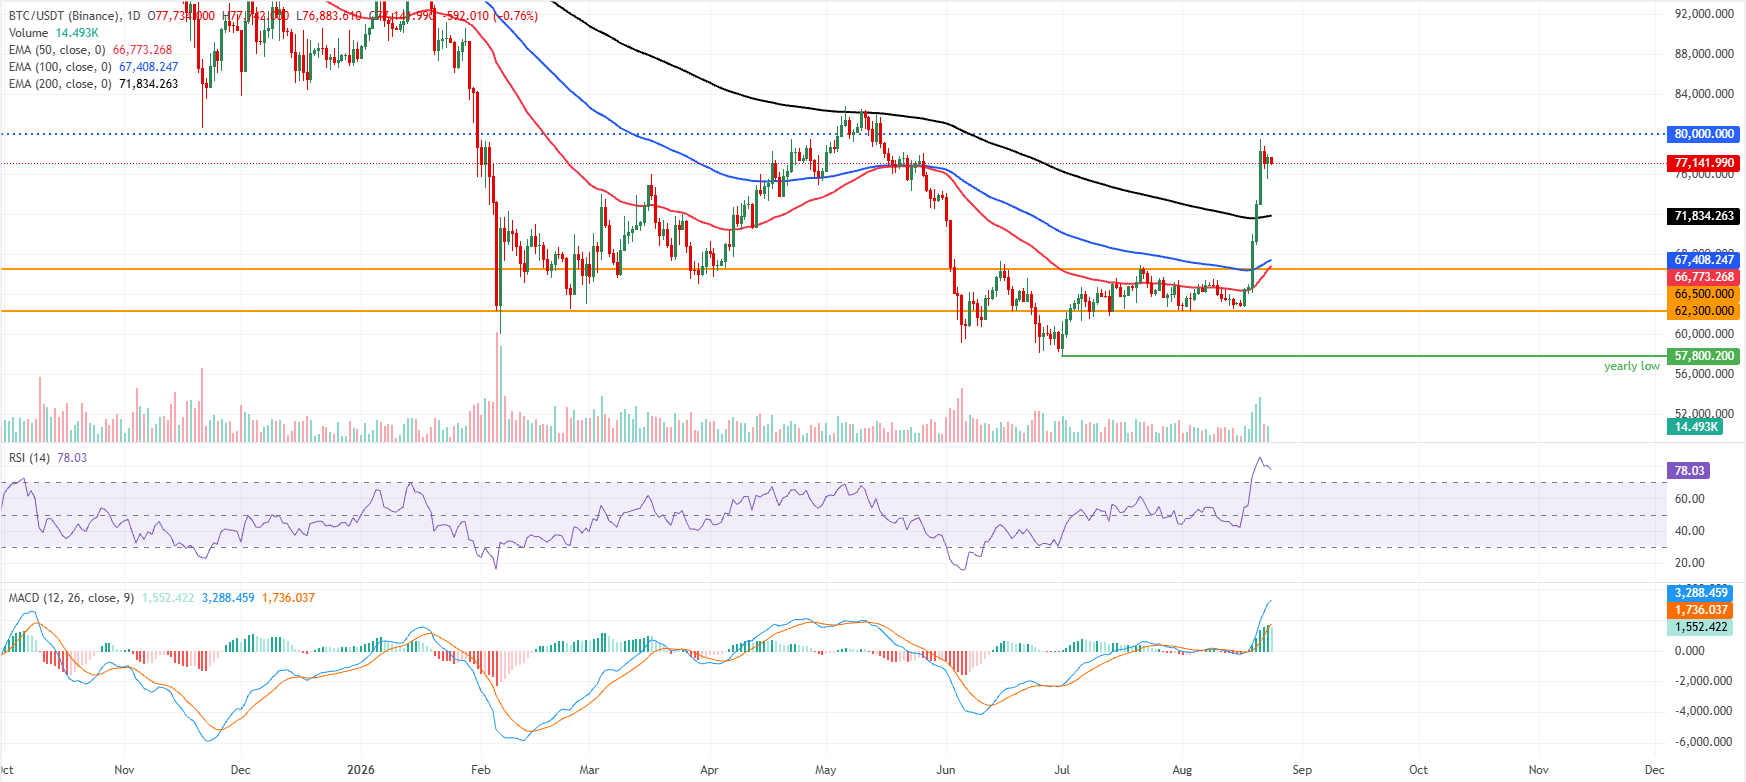
Bitcoin price trades at $77,150, extending its advance well above key Exponential Moving Averages (EMAs) and leaving the near-term bias bullish but stretched after a 23.58% surge last week. The 50-day EMA at $66,773, the 100-day EMA at $67,408 and the 200-day EMA at $71,834 now sit well below spot, suggesting a strongly supported uptrend, while the horizontal level at $80,000 acts as the next topside resistance reference above the market in this accelerated phase.
Momentum is overheated, with the Relative Strength Index (RSI) holding in overbought territory at 78 and the Moving Average Convergence Divergence (MACD) deeply positive, hinting that while buyers remain in control, the risk of a corrective pause is rising.
On the downside, any pullback is likely to first eye the 200-day EMA near $71,834, with additional EMA cushions at $67,408 and $66,774.
On the topside, a sustained push toward the $80,000 area would keep the uptrend intact despite the overbought momentum backdrop.
Ethereum’s momentum indicators signal overbought conditions
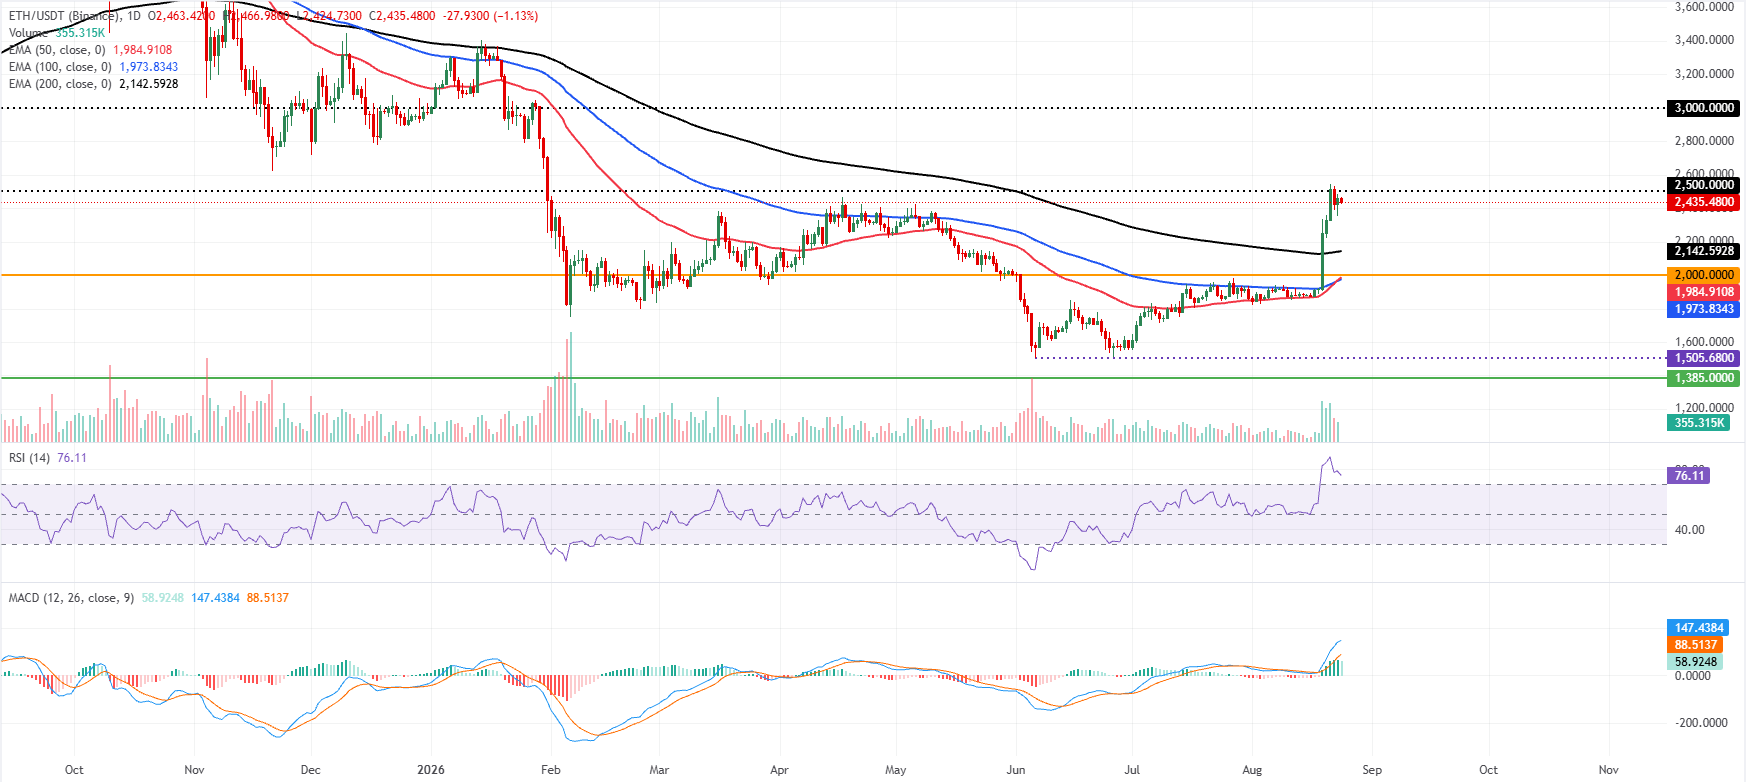
Ethereum trades at $2,415, holding a bullish near-term bias as price remains comfortably above the 50-day, 100-day and 200-day EMAs. The clustering of the short- and medium-term EMAs below the market suggests a well-supported uptrend, while the RSI near 76 hints at overbought conditions. The MACD is firmly positive, reinforcing strong upside momentum, though the elevated readings suggest a corrective pause is possible.
On the topside, immediate resistance is seen at the horizontal barrier around $2,500, followed by a more significant cap near $3,000.
On the downside, the first layer of support is the current trading area, with deeper protection from the 200-day EMA near $2,142 and the psychological $2,000 level. Below there, the 50- and 100-day EMAs around $1,984 and $1,973, respectively, should offer additional demand before any move toward the distant structural floor at $1,385.
XRP surges over 50%
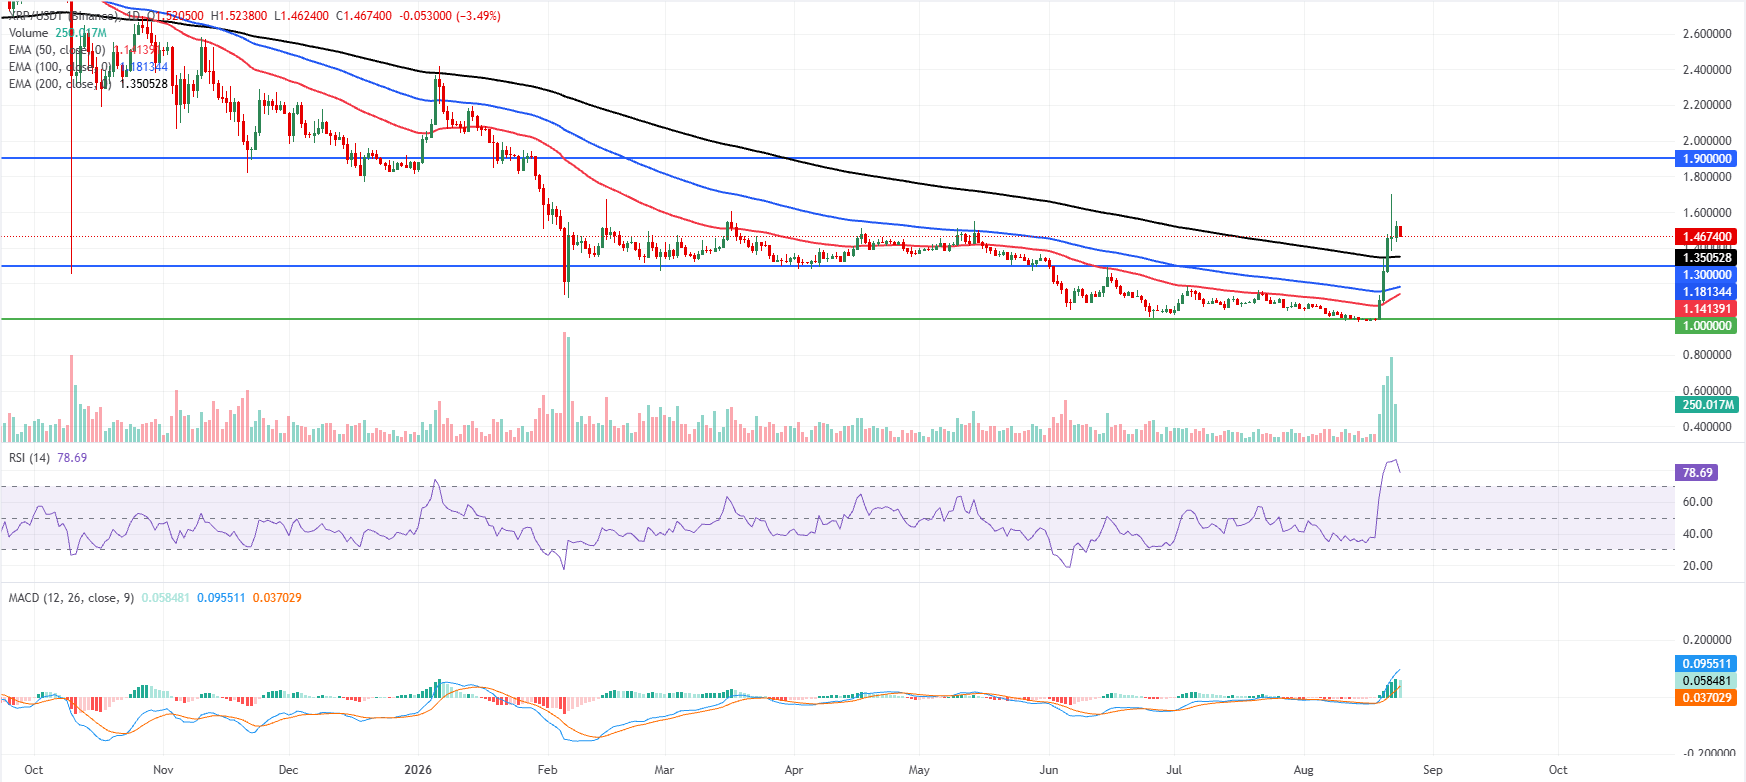
XRP price trades at $1.467 on Monday, extending its strong upswing after surging over 50% in the previous week. Moreover, XRP is above the 50-day, 100-day, and 200-day EMAs at $1.141, $1.181, and $1.350, respectively, which now underpin a clear bullish near-term bias.
The move has been fueled by heavy participation, with recent volume well above prior weeks. At the same time, the RSI at 78 sits in overbought territory, hinting that the rally is stretched even as the MACD remains firmly positive, reinforcing upward momentum.
On the downside, initial demand is expected around $1.350, where the 200-day EMA clusters with prior price action, ahead of horizontal support at $1.300; deeper pullbacks would expose the 100-day EMA at $1.181 and the 50-day EMA near $1.141, with $1.000 marking a more distant structural floor.
On the topside, the next notable resistance is the horizontal barrier at $1.900, and with momentum already overheated, any test of this level could trigger profit-taking and a corrective phase toward the underlying EMA supports.
(The technical analysis of this story was written with the help of an AI tool. Know more.)
(This story was corrected on August 24 at 05:13 GMT to say, in the second paragraph, that the horizontal level at $80,000 acts as the next topside resistance, not support.)
Cryptocurrency prices FAQs
Token launches influence demand and adoption among market participants. Listings on crypto exchanges deepen the liquidity for an asset and add new participants to an asset’s network. This is typically bullish for a digital asset.
A hack is an event in which an attacker captures a large volume of the asset from a DeFi bridge or hot wallet of an exchange or any other crypto platform via exploits, bugs or other methods. The exploiter then transfers these tokens out of the exchange platforms to ultimately sell or swap the assets for other cryptocurrencies or stablecoins. Such events often involve an en masse panic triggering a sell-off in the affected assets.
Macroeconomic events like the US Federal Reserve’s decision on interest rates influence crypto assets mainly through the direct impact they have on the US Dollar. An increase in interest rate typically negatively influences Bitcoin and altcoin prices, and vice versa. If the US Dollar index declines, risk assets and associated leverage for trading gets cheaper, in turn driving crypto prices higher.
Halvings are typically considered bullish events as they slash the block reward in half for miners, constricting the supply of the asset. At consistent demand if the supply reduces, the asset’s price climbs.
Author

Manish Chhetri
FXStreet
Manish Chhetri is a crypto specialist with over four years of experience in the cryptocurrency industry.



