Three reasons why XRP and XLM indicate a growing risk of a deeper correction
- Ripple and Stellar prices are trading red on Tuesday after correcting slightly the previous day.
- Santiment data highlights that the social dominance of both XRP and XLM is falling sharply, signaling waning retail interest.
- Derivatives metrics back the bearish outlook with negative funding rates and falling open interest.
- The technical outlook for both altcoins points to increasing bearish momentum, suggesting further downside risks.

Ripple (XRP) and Stellar (XLM) prices are under renewed pressure this week, with XRP slipping below $1.32 and XLM below $0.17 on Tuesday. Fading trader interest, weakening derivatives metrics, and deteriorating technical structure suggest downside risks for both altcoins could be building, with the potential for a deeper correction in the near term.
On-chain data signals fading investors’ interest
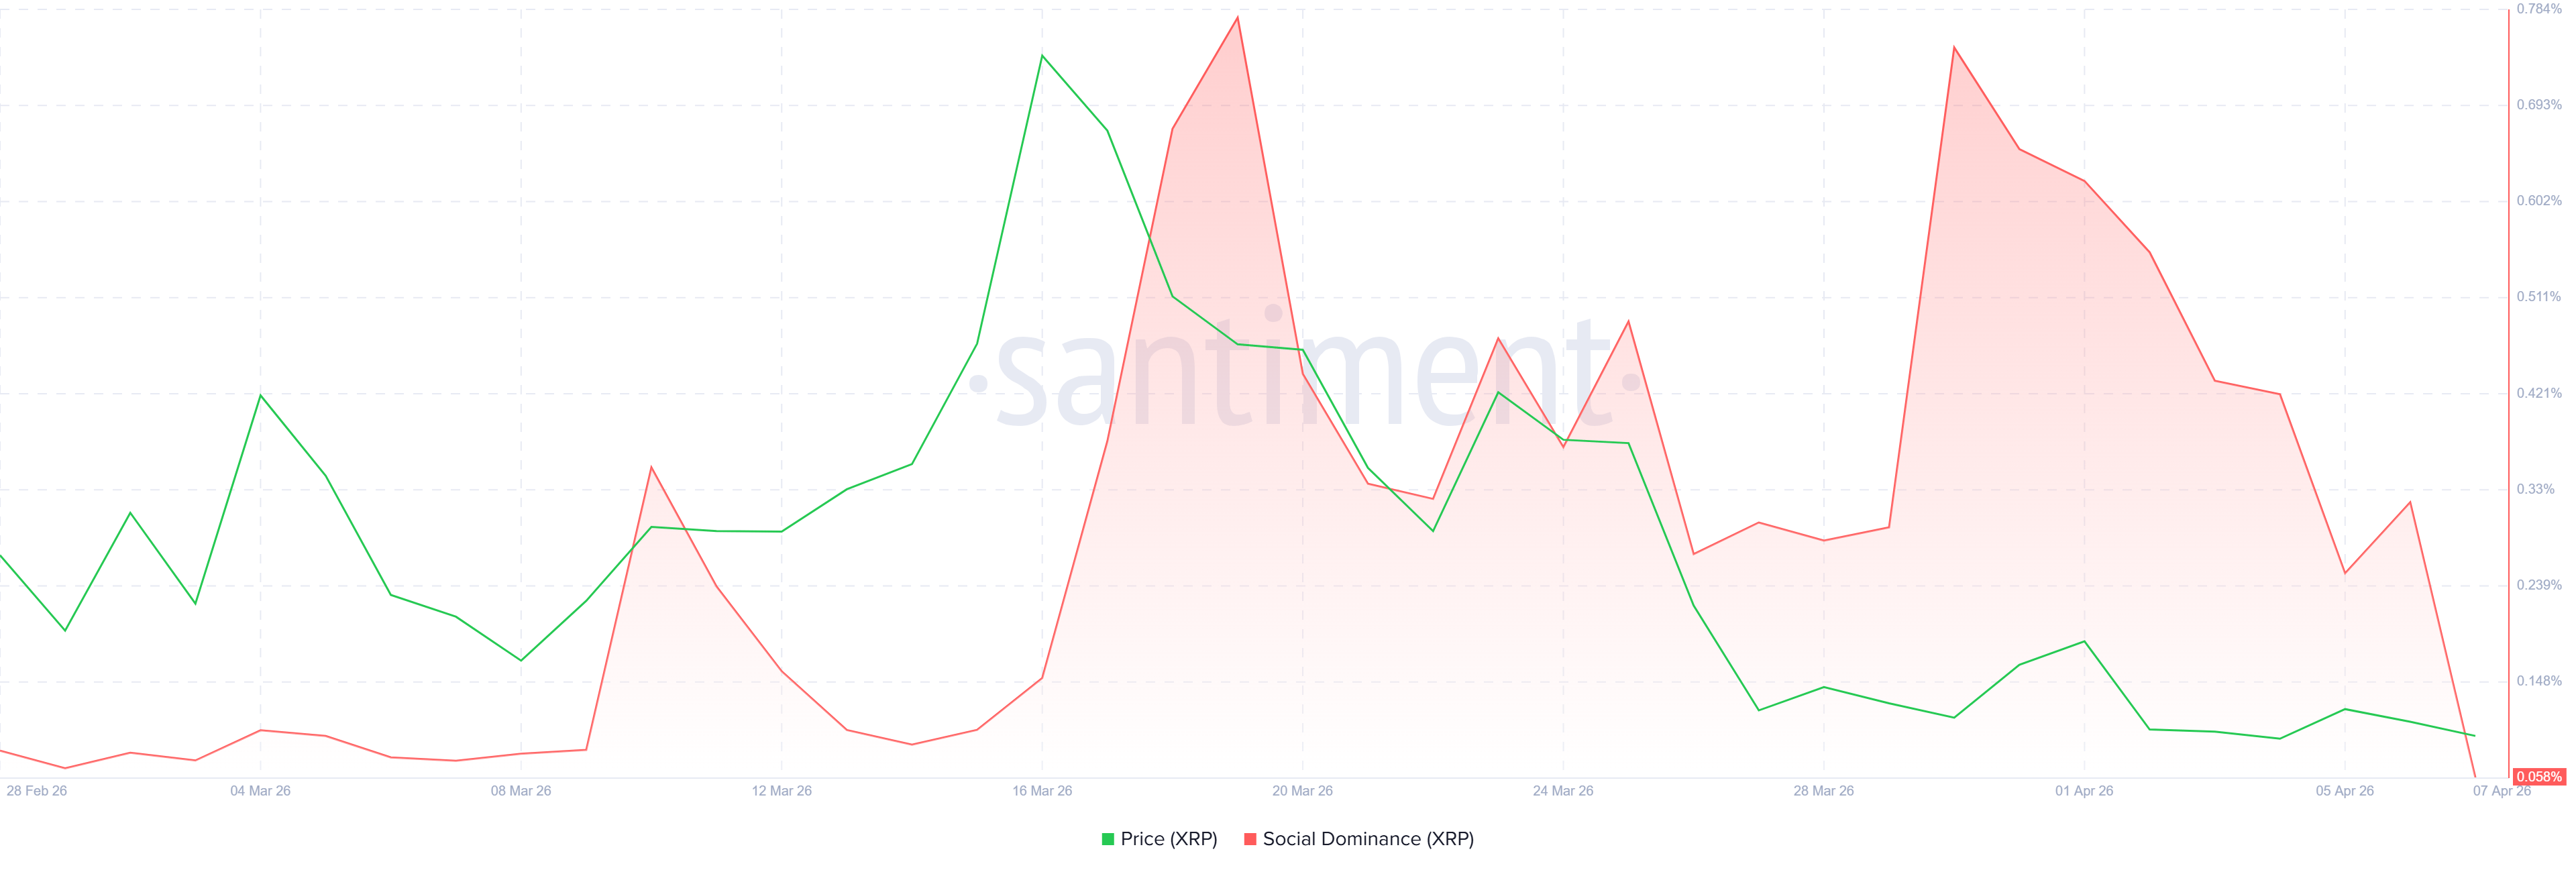
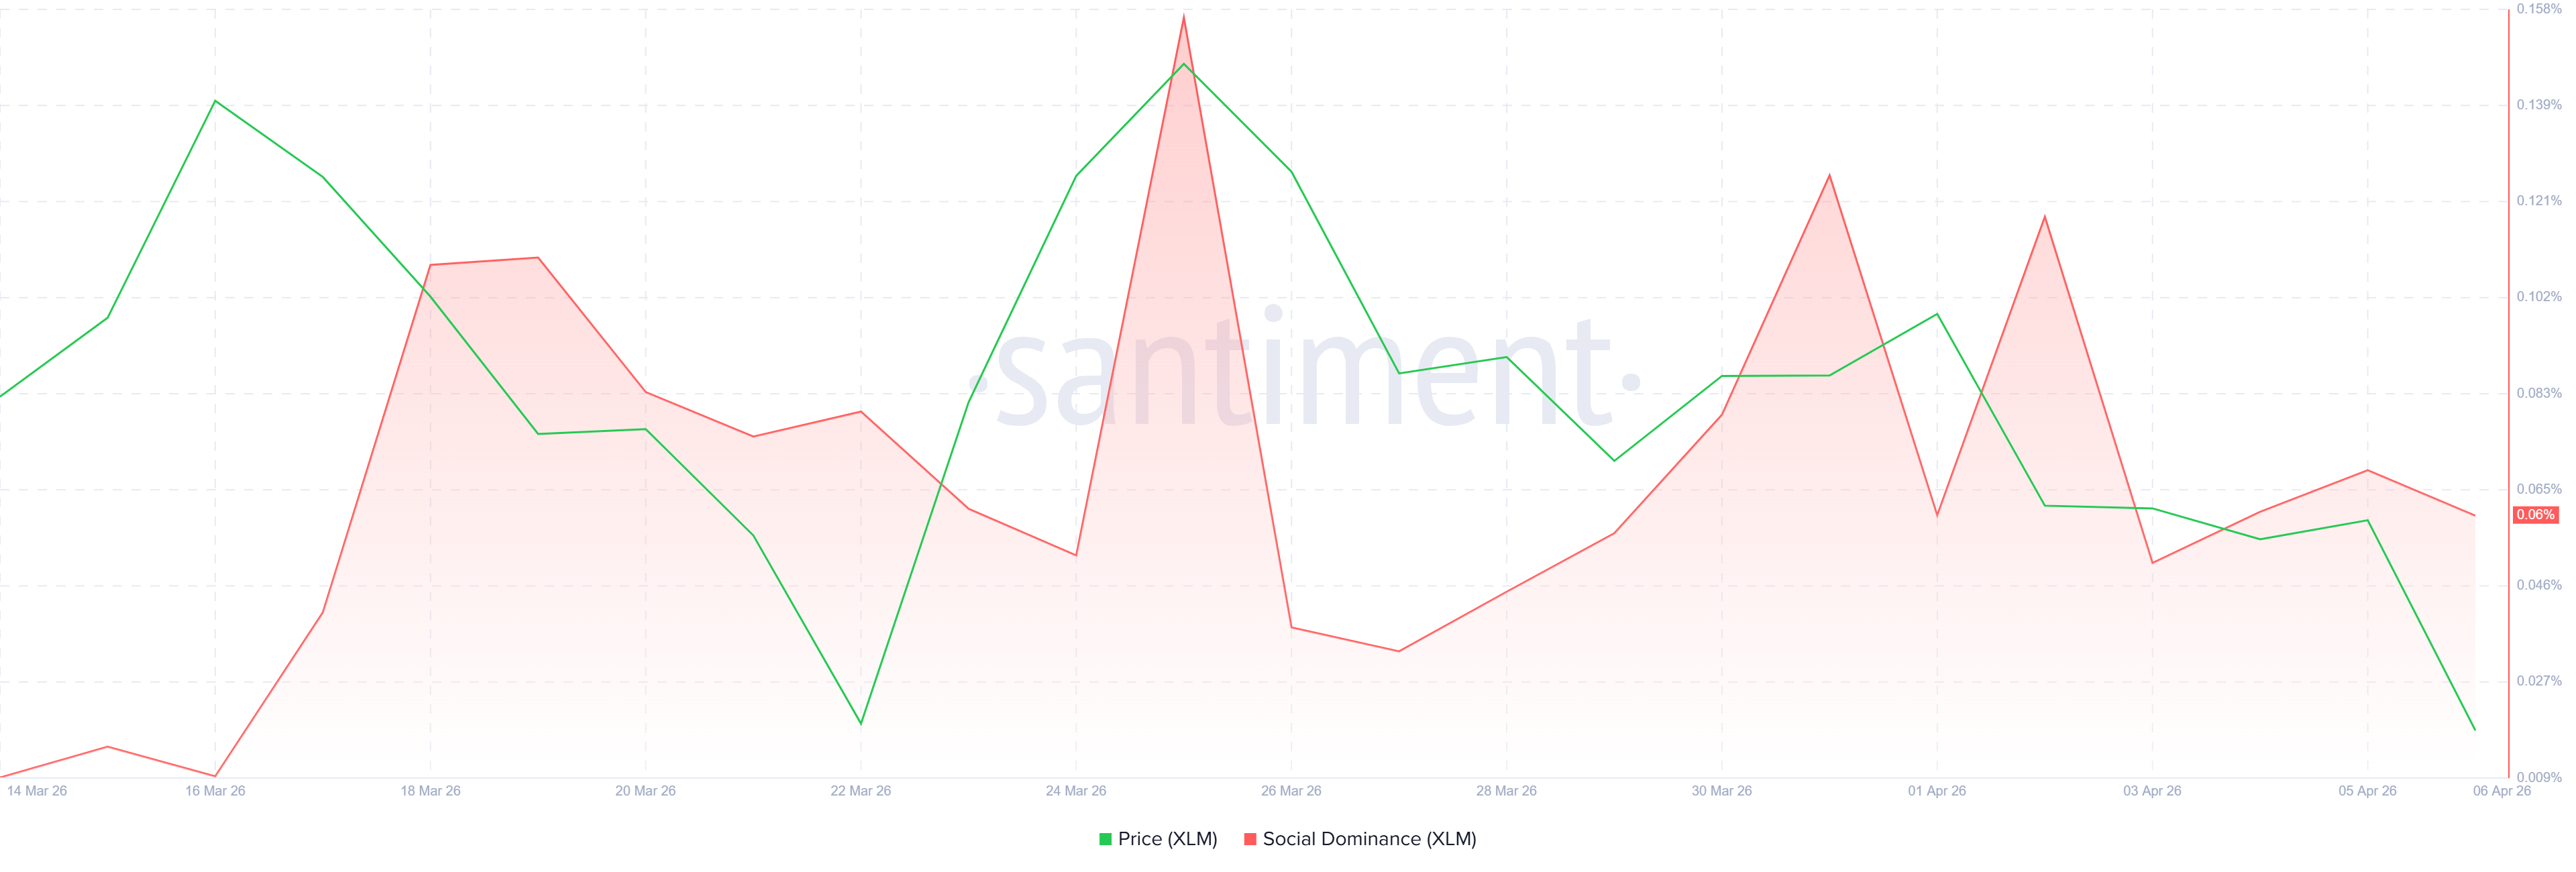
Santiment’s Social Dominance metric for XRP and XLM supports a bearish outlook. The index measures the share of XRP- and XLM-related discussions across the cryptocurrency media.
Both altcoins have been in a downtrend since the end of March, with XRP and XLM down 0.058% and 0.06%, respectively, as shown in the chart below. This fall indicates fading market interest and sentiment among XRP and XLM investors.
Derivatives metrics suggest a bearish bias
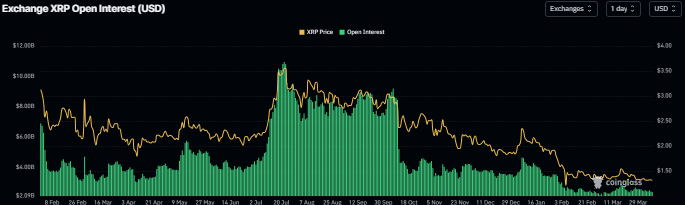
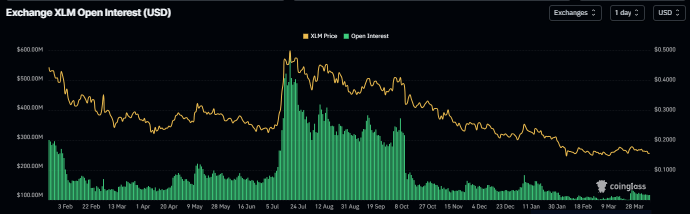
On the derivatives side, metrics from both cryptocurrencies show bearish bias. XRP’s futures Open Interest (OI) at the exchange drops to $2.26 billion on Tuesday and has been steadily falling since early January. Similarly, the OI for XLM drops to $100.45 million on Tuesday and has been steadily falling since mid-October. This drop in OI for both altcoins reflects waning investor participation.
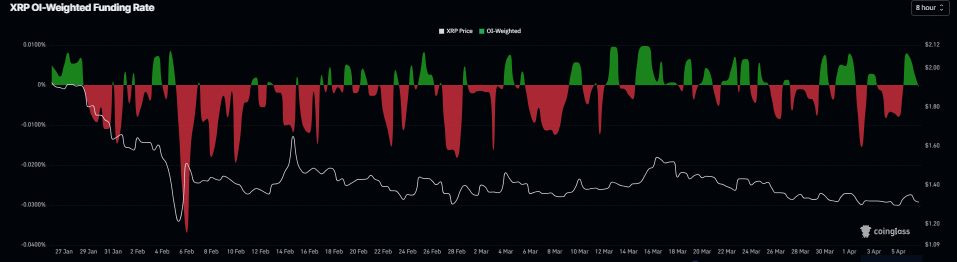
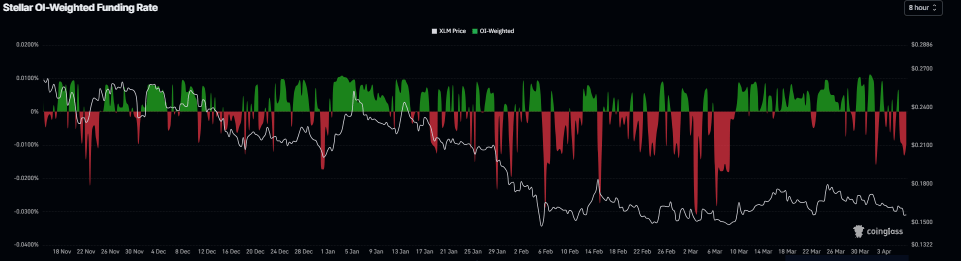
In addition, the funding rates for XRP and XLM also support a bearish bias. The metric for XRP flipped to a negative rate on Tuesday, currently reading -0.0005%. Similarly, for XLM, the metric flipped to a negative rate on Monday, reading -0.0097% on Tuesday. These negative rates indicate shorts are paying longs, suggesting bearish sentiment toward XRP and XLM.
Technical outlook: Momentum indicators show bearish signs
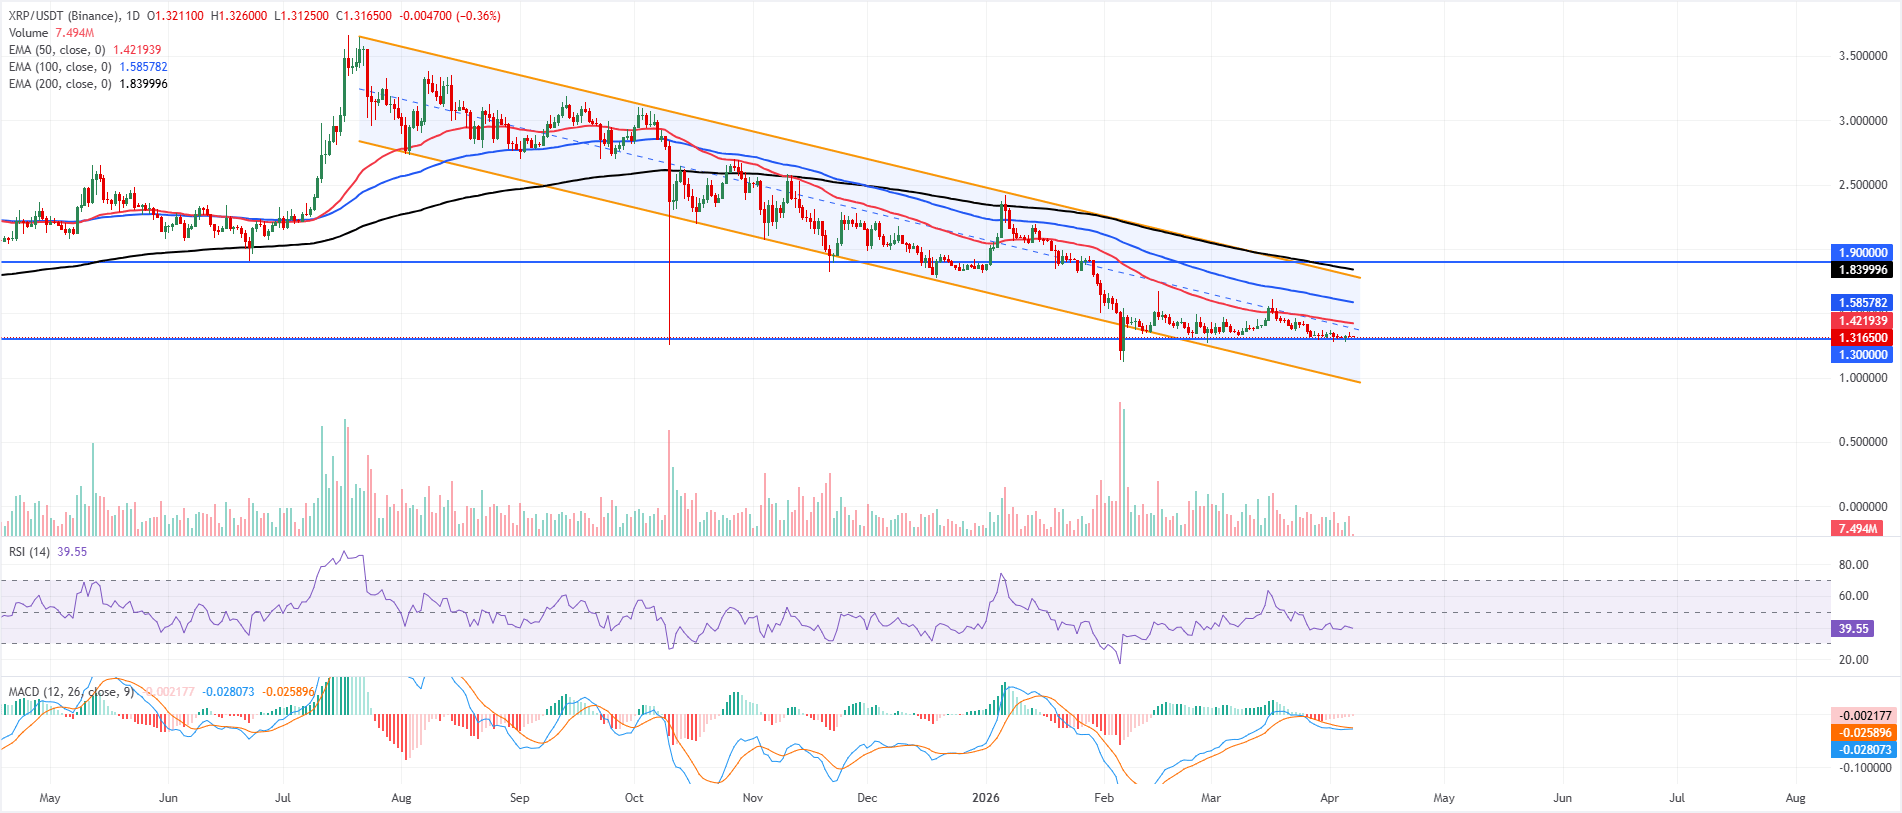
XRP price is trading at $1.31 on Tuesday after a mild correction the previous day. XRP remains embedded in a descending parallel channel from above $2.80, keeping the near-term bias bearish despite the recent stabilization around $1.32. Price holds below the 50-day, 100-day and 200-day Exponential Moving Averages, which continue to slope lower and cap recovery attempts within the broader downtrend.
The Relative Strength Index (RSI) on the daily chart, around 40, remains below the midline, reflecting subdued buying interest and aligning with persistent downside pressure. The Moving Average Convergence Divergence (MACD) indicator improves slightly but remains below the zero line, suggesting only modest relief within a still dominant bearish phase.
Immediate support is located near $1.30, where a horizontal level underpins price just above the channel’s lower half; a clear break below this floor would expose the channel bottom around $0.97.
If $1.30 continues to hold, XRP would need to reclaim the 50-day EMA near $1.42 to ease downside pressure and open the way toward initial resistance at $1.79 along the upper boundary of the descending channel. A sustained move above that channel top would then target the higher resistance band around $1.90, where a prior horizontal barrier converges with the longer-term EMAs, turning the focus toward a more durable trend reversal only if decisively cleared.
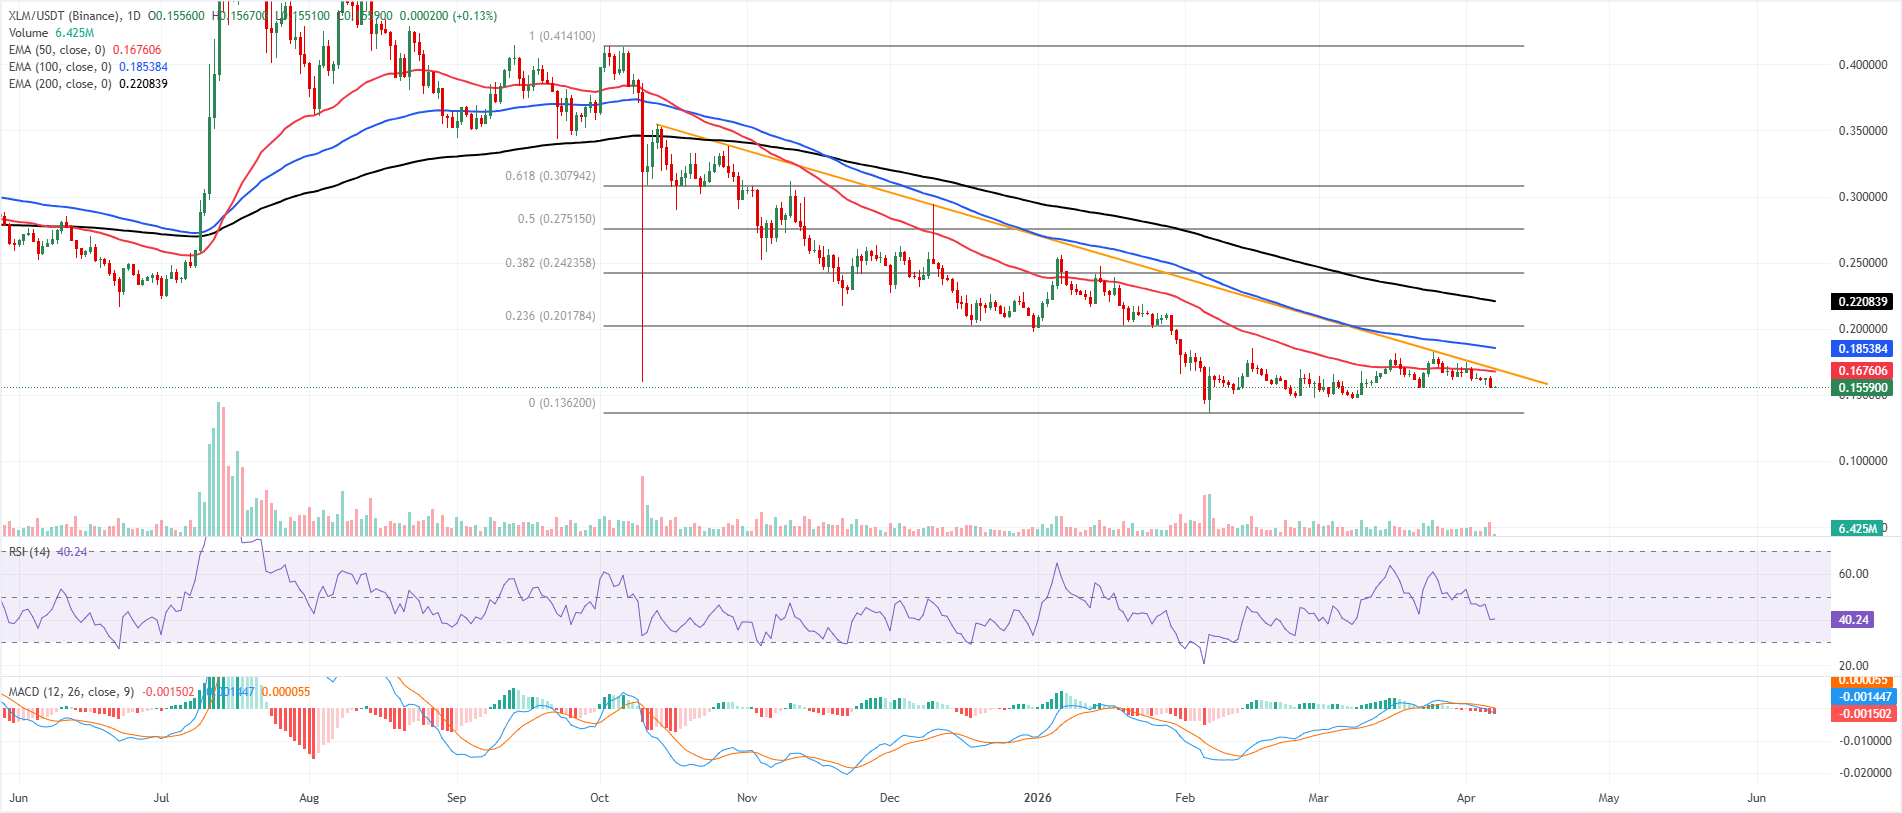
Stellar price is trading at $0.16 on Tuesday after correcting by over 4% the previous day. The near-term bias turns cautiously bearish after the XLM failed to sustain the late-March recovery and slipped back under the descending trendline resistance near $0.17. Price holds below the 50-day EMA around $0.17, while the 100- and 200-day EMAs cluster much higher near $0.19 and $0.22, framing the broader structure as a corrective phase within a dominant downtrend.
The RSI on the daily chart hovers just above 40, signaling fading bullish momentum after the recent bounce, and the MACD indicator has rolled back below its signal line near the zero axis, reinforcing a soft downside bias rather than a trend acceleration.
Initial resistance emerges at the 50-day EMA around $0.17, followed by the Fibonacci 23.6% retracement of the $0.14–$0.41 downswing at $0.20, where the 100-day average also converges to form a stronger supply zone.
On the downside, immediate support is near the recent lows at $0.15, with a break exposing the psychological $0.14 area, which aligns with the lower end of the prevailing range and sits just above the $0.14 Fibonacci anchor from the same $0.41–$0.14 decline. A daily close back above $0.17 would ease short-term pressure and open the door for a corrective push toward $0.20, while sustained trading below $0.15 would extend the bearish sequence and keep focus on deeper retracement of the prior advance.
(The technical analysis of this story was written with the help of an AI tool.)
Author

Manish Chhetri
FXStreet
Manish Chhetri is a crypto specialist with over four years of experience in the cryptocurrency industry.



