Solana Price Forecast: SOL struggles as geopolitical tensions and fading momentum cap recovery prospects
- Solana trades at $86.50 on Monday, down nearly 7% in the previous week.
- Mixed sentiment among traders amid rising geopolitical tensions weighs on SOL’s recovery prospects.
- The technical outlook suggests caution, as momentum indicators signal fading bullish momentum.

Solana (SOL) price trades around $86.50 at the time of writing on Monday after losing nearly 7% in the previous week. Mixed signals amid rising geopolitical tensions in the Middle East war suggest that SOL’s short-term outlook remains uncertain, limiting the scope for a recovery.
The Middle East war weighs on investor sentiment
Crypto markets begin the week on a cautious note amid escalating tensions between the US and Iran, which continue to weigh on investor sentiment.
On Monday, US President Donald Trump said on his Truth Social account, “PEACE THROUGH STRENGTH, TO PUT IT MILDLY!!!”
This comment comes as Iran said on Sunday it would strike the energy and water systems of its Gulf neighbours in retaliation if Donald Trump follows through with a threat delivered a day earlier to hit Iran’s electricity grid in 48 hours.
These rising war tensions have pressured risk assets, with Bitcoin closing below $67,360 on Sunday, triggering widespread liquidations across the crypto market. Solana’s price has been falling steadily, losing nearly 7% in the previous week, and closed below $87 on Sunday while trading cautiously on Monday.
Mixed sentiment among traders caps recovery
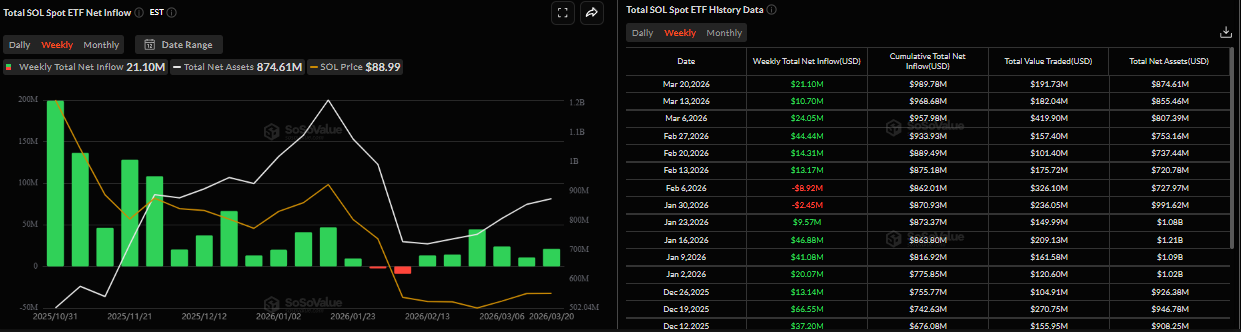
Despite ongoing conflicts, institutional demand for Solana remained robust last week. SoSoValue recorded an inflow of $21.10 million last week, making it the sixth straight week of positive flows. However, if these flows turn negative amid the Middle East war this week, the SOL price could correct further.
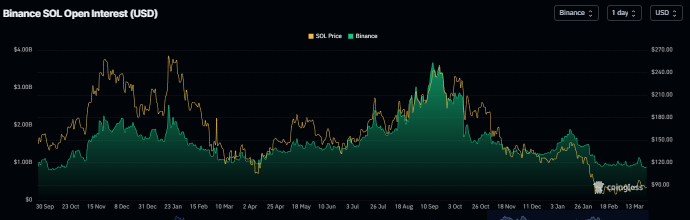
On the derivatives side, data supports a bearish outlook for Solana. SOL’s futures Open Interest (OI) at Binance exchange dropped to $871.40 million on Monday and has been continuously falling since mid-January. This drop in OI reflects waning investor participation and projects a bearish outlook.
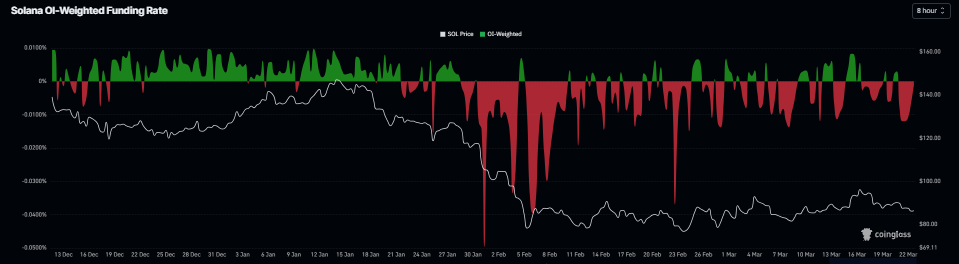
In addition, CoinGlass funding rates data also supports negative sentiment. The metric flipped to a negative rate on Saturday and reads -0.0011% on Monday, indicating shorts are paying longs and suggesting bearish sentiment toward SOL.
Solana Price Forecast: SOL momentum indicators show fading bullish strength
Solana price trades at $86.50 as of writing on Monday after falling nearly 7% in the previous week. The near-term bias is cautiously bearish as SOL slips back into the parallel channel after holding above the upper channel boundary at $92.80 in the previous week.
The Relative Strength Index (RSI) on the daily chart at 46 is neutral but remains above oversold territory, suggesting only moderate downside momentum. The Moving Average Convergence Divergence (MACD) line has slipped just below the signal line and is gravitating toward the zero mark, which points to fading upside pressure and suggests early signs of a bearish phase as the price failed to break above the long-term descending trendline near $91.44.
Initial resistance is located at the channel top near $92.11, reinforced by the descending trendline that previously capped gains around $91.44, while a sustained move above there would expose the 23.6% Fibonacci retracement of the $67.50–$148.44 slide at $86.60, turning into a higher support base and opening the way toward the 100-day Exponential Moving Average at $107.
On the downside, immediate support aligns at the channel floor near $77.12, followed by the Fibonacci origin region around $67.50, where a break would negate the consolidating structure and shift the focus back to the broader downtrend defined by the higher retracement levels at 38.2% ($98.42) and 50.0% ($107.97) acting as medium-term resistance on any stronger recovery.
-1774243546404-1774243546405.png)
(The technical analysis of this story was written with the help of an AI tool.)
Author

Manish Chhetri
FXStreet
Manish Chhetri is a crypto specialist with over four years of experience in the cryptocurrency industry.