Solana Price Forecast: SOL extends rally as tokenized equity holders hit a record
- Solana climbs above $111.70 on Monday after gaining nearly 12% last week.
- SOL announced on X that its tokenized equity ecosystem hit a new all-time high, with 850,000 unique on-chain holders.
- Improving momentum indicators and strengthening institutional demand support further gains in SOL.

Solana (SOL) extends its gains, trading above $111.70 at the time of writing on Monday after rallying nearly 12% last week. The bullish price action comes as growth in Solana’s tokenized equity ecosystem reaches a new milestone. Meanwhile, improving momentum indicators and strengthening institutional demand point to further gains in SOL.
Solana tokenized equities ecosystem reaches a new milestone
Solana announced on its official X post on Sunday that its tokenized equities hit a new all-time high (ATH) of 850,000 unique on-chain holders. This indicates continued growth in tokenized assets on the network, highlighting market confidence and growing participation, which could boost the SOL price in the long term.
Strengthening institutional demand
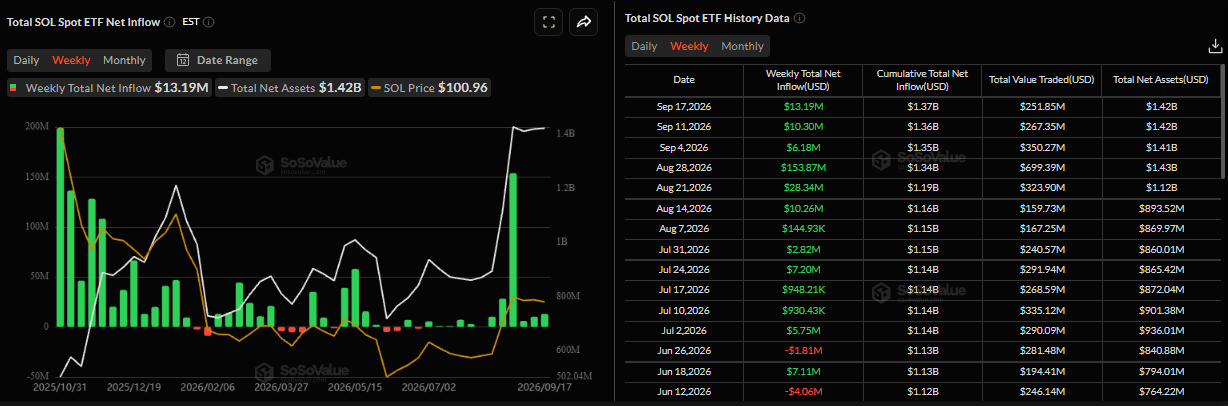
Institutional demand for Solana has strengthened. SoSoValue data showed that SOL Exchange-Traded Funds (ETFs) recorded an inflow of $13.19 million last week, marking 12 weeks of continued inflows since early July. If these inflows continue and intensify this week, SOL could extend gains.
Solana technical outlook: Improving momentum indicators hint at higher highs
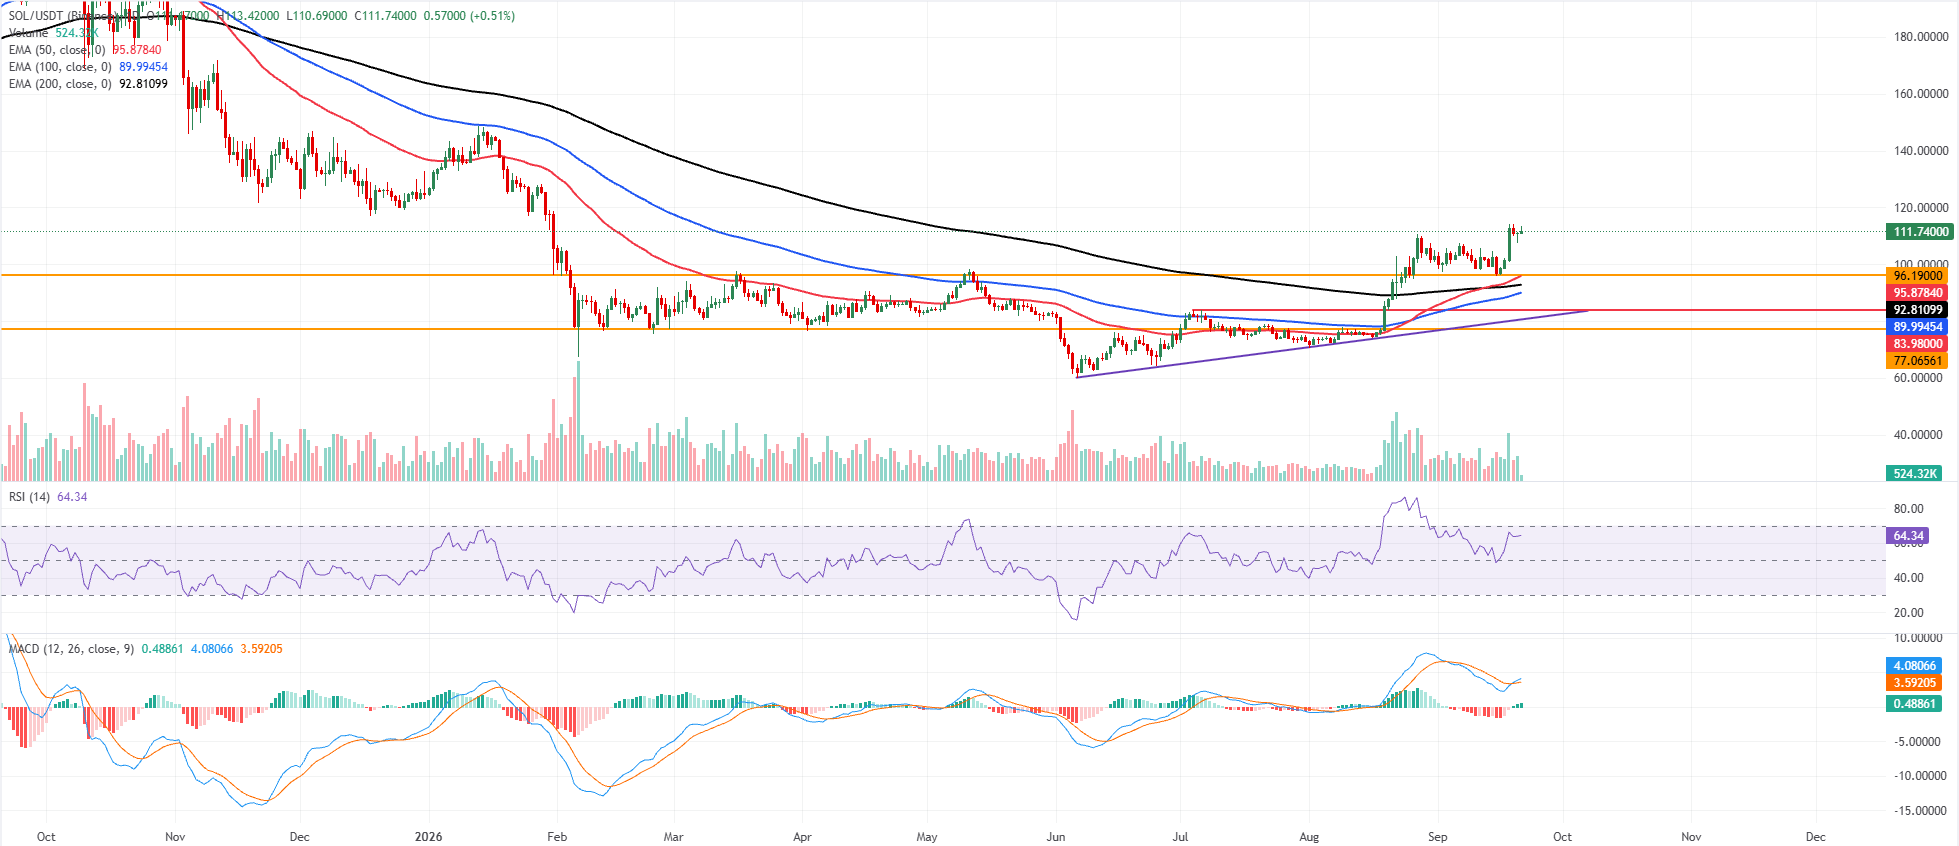
Solana price trades at $111.74 on Monday after gaining nearly 12% last week. SOL is maintaining a constructive bullish bias as it holds well above the 50-day, 100-day, and 200-day exponential moving averages (EMAs). The uptrend support line guiding the advance has been tested around the current region, while a firm close above recent highs sustains the broader upward structure.
Momentum indicators support this stance, with the Relative Strength Index (RSI) hovering in the mid‑60s and the Moving Average Convergence Divergence (MACD) line above the signal line in positive territory, suggesting buyers still retain near‑term control.
On the downside, initial cushioning appears near the immediate pivot zone around $111. A deeper pullback would expose the horizontal support and the 50-day EMA clustered just below $96, ahead of the 200-day EMA near $93 and the 100-day EMA closer to $90. At the same time, a more pronounced correction could revisit the broader structural floor around $77.
On the topside, bulls are aiming for the $120 mark, where a close above suggests further gains.
(The technical analysis of this story was written with the help of an AI tool. Know more.)
Author

Manish Chhetri
FXStreet
Manish Chhetri is a crypto specialist with over four years of experience in the cryptocurrency industry.




