Solana Price Forecast: SOL extends correction below $80 as bearish bets surge
- Solana declines for a second consecutive day, falling below $80 on Tuesday.
- Traders increase their exposure to short positions in Solana as the Open Interest-weighted funding rate remains negative.
- Momentum readings weaken as the MACD maintains a sell signal and the RSI slides toward oversold territory.

Solana (SOL) edges lower below $80.00 at the time of writing on Tuesday, weighed down by negative sentiment due to the United States (US) and Israel’s war with Iran. Investors across global markets have remained jittery since late February, when the war broke out, with sentiment in the crypto industry staying in extreme fear territory.
Retail demand shrinks as Solana slides
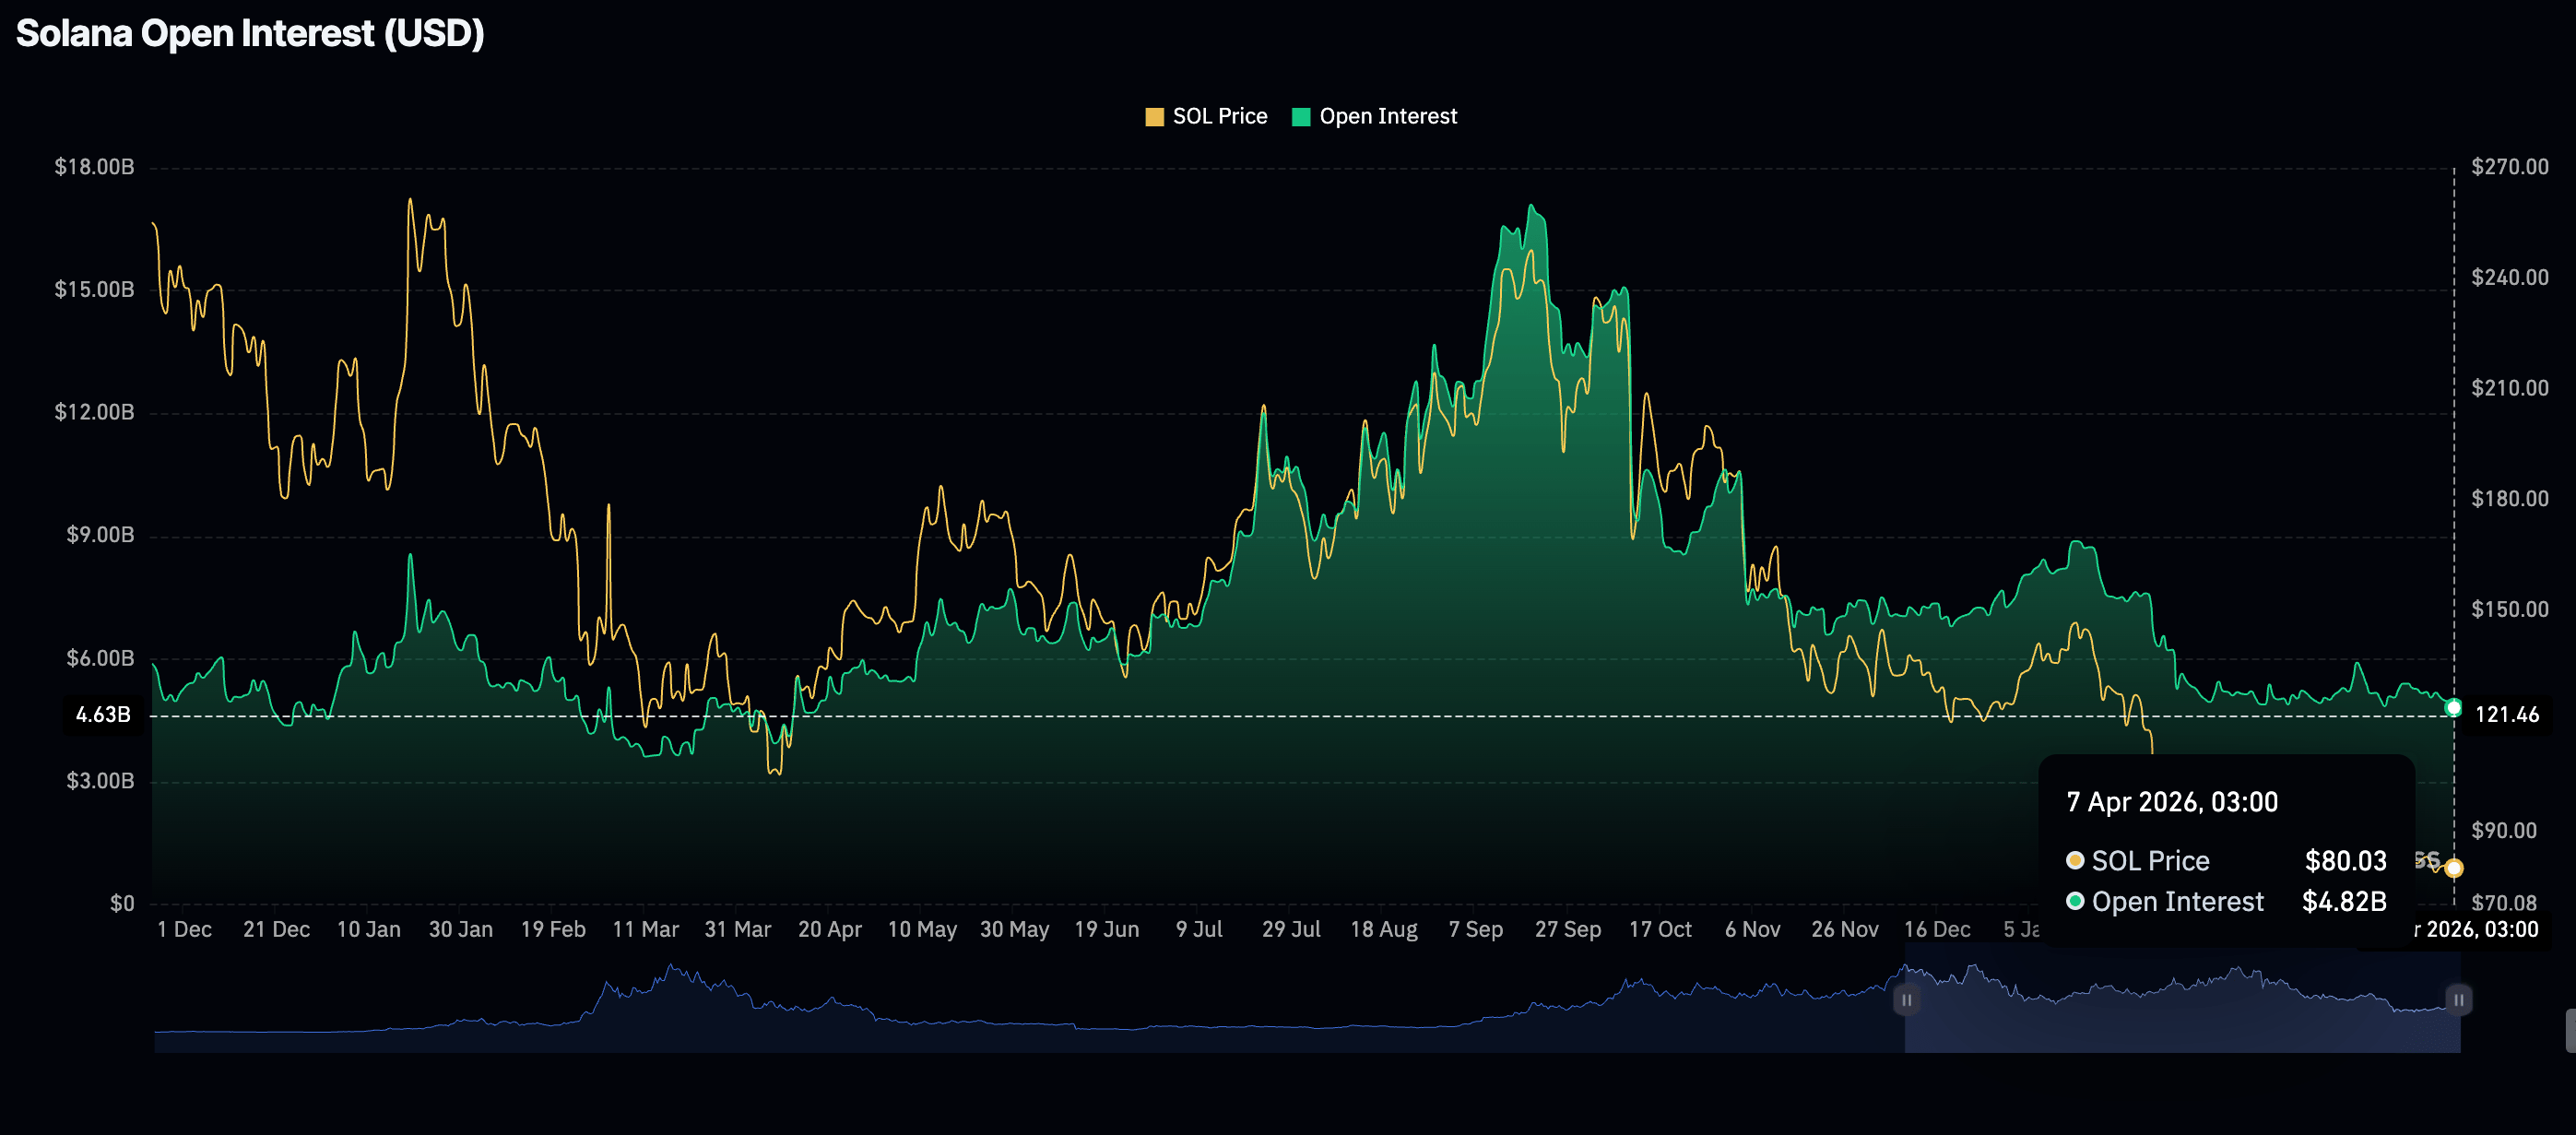
Solana faces suppressed retail demand, as reflected by futures Open Interest (OI) shrinking to $4.82 billion on Tuesday, from $4.97 billion the previous day. Since OI reflects the notional value of outstanding futures and options contracts, persistent declines indicate investors are losing conviction and are unwilling to open new positions.
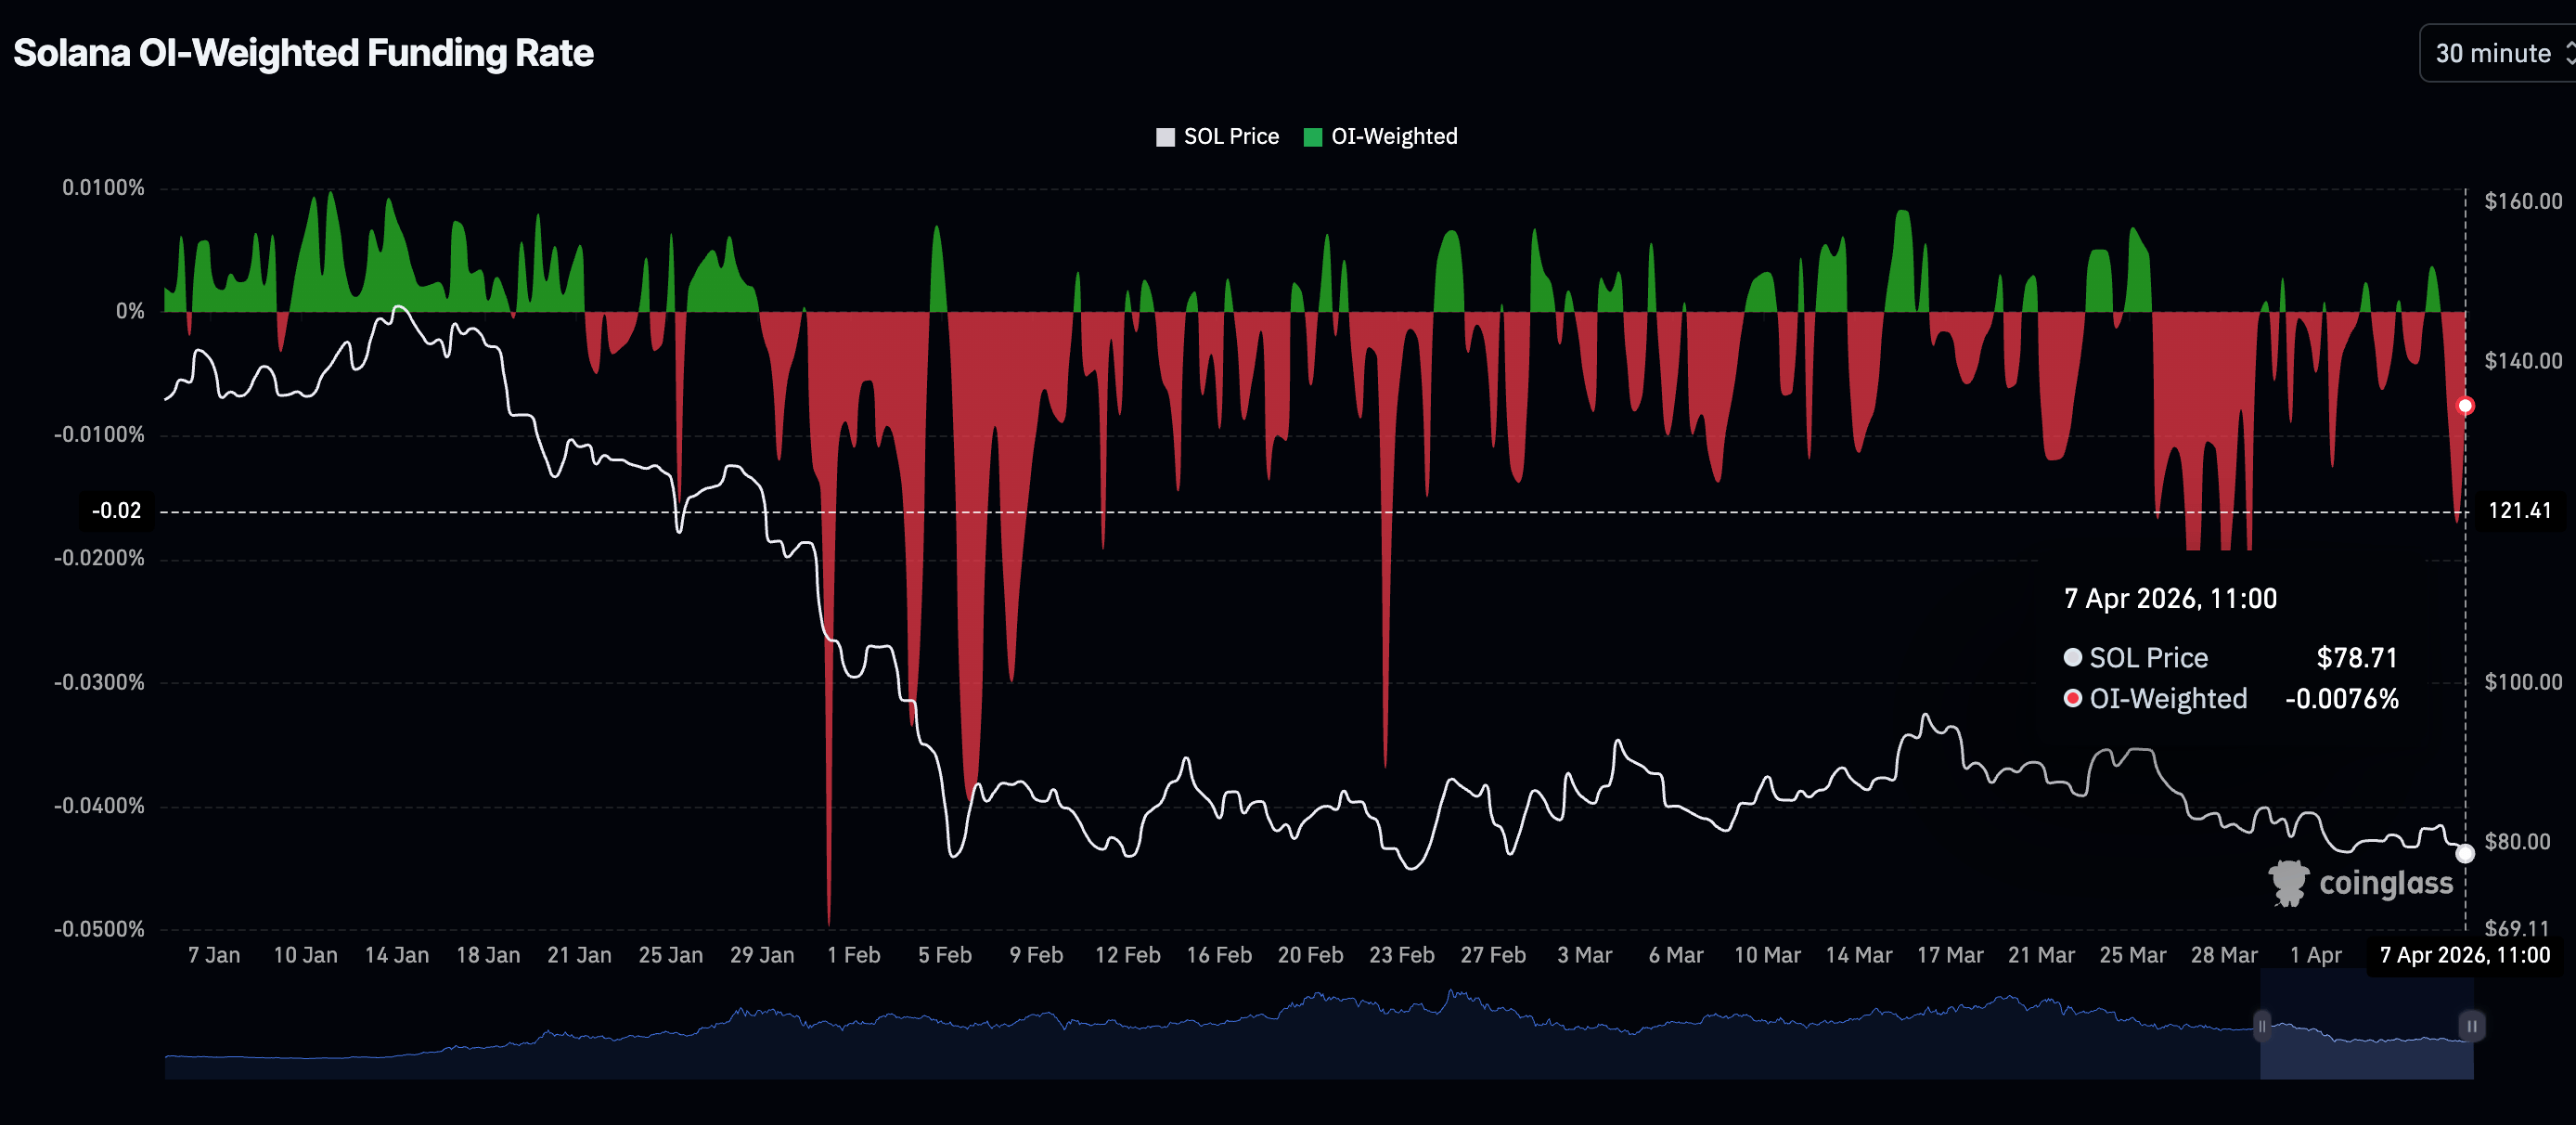
Meanwhile, traders appear to be losing conviction in Solana’s ability to sustain an uptrend, which may explain the surge in bearish bets, keeping the futures Open Interest (OI) weighted funding rate negative at -0.0074% on Tuesday, down from 0.0004% on Monday. If the outlook fails to improve, pressure will continue to weigh on Solana amid a persistent bearish trend.
Technical outlook: Solana sellers tighten their grip
Solana is trading around $78.52, maintaining a bearish near-term bias as price extends its retreat below the broken descending resistance trendline. The cluster of Exponential Moving Averages (EMAs) above spot, with the 50-day EMA now descending toward the mid-80s while the 100-day and 200-day EMAs remain higher, reinforces a downside-skewed backdrop.
Momentum confirms selling pressure, with the Moving Average Convergence Divergence (MACD) indicator below its signal and under the zero line as the negative histogram widens on the daily chart, while the Relative Strength Index (RSI) slips toward 38, indicating persistent bearish momentum rather than oversold exhaustion.
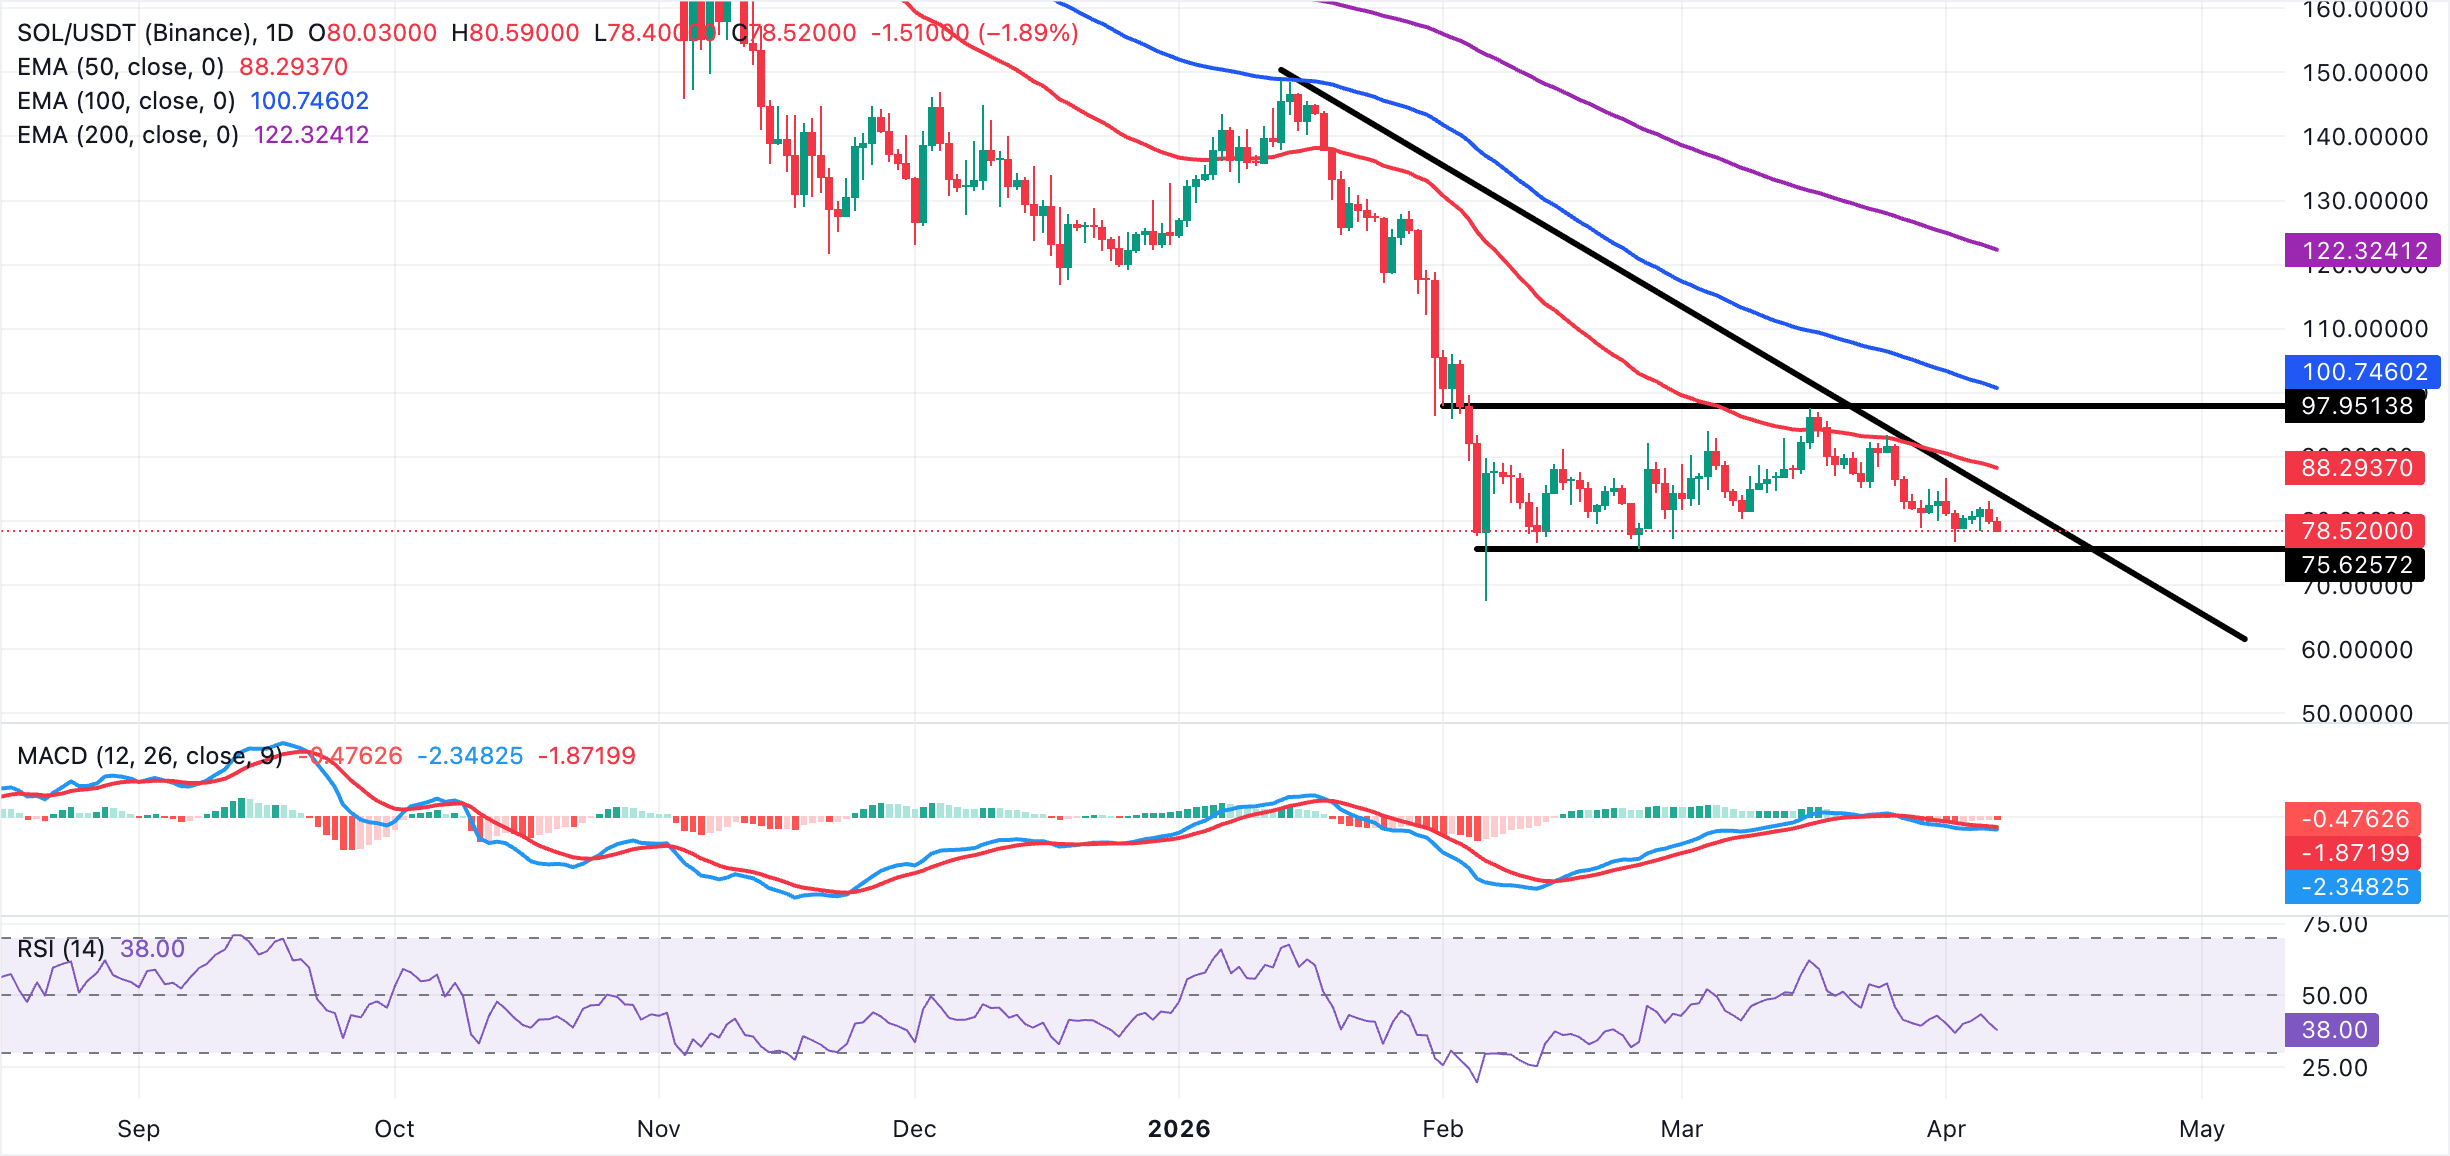
Solana's initial resistance now stands near $82.00, aligning with recent reaction highs, followed by a stronger barrier at $84.00, which capped the latest bounce. A daily close above $84.00 would be needed to ease immediate downside pressure and expose $88.00 as the next upside level.
On the downside, minor support emerges at $78.00, with a clear break opening the way to $75.00 as the next bearish target. Below there, the $70.00 area marks deeper support where sellers could start to fade, as extended distance from the 50-day EMA would stretch the prevailing downward move.
Cryptocurrency metrics FAQs
The developer or creator of each cryptocurrency decides on the total number of tokens that can be minted or issued. Only a certain number of these assets can be minted by mining, staking or other mechanisms. This is defined by the algorithm of the underlying blockchain technology. On the other hand, circulating supply can also be decreased via actions such as burning tokens, or mistakenly sending assets to addresses of other incompatible blockchains.
Market capitalization is the result of multiplying the circulating supply of a certain asset by the asset’s current market value.
Trading volume refers to the total number of tokens for a specific asset that has been transacted or exchanged between buyers and sellers within set trading hours, for example, 24 hours. It is used to gauge market sentiment, this metric combines all volumes on centralized exchanges and decentralized exchanges. Increasing trading volume often denotes the demand for a certain asset as more people are buying and selling the cryptocurrency.
Funding rates are a concept designed to encourage traders to take positions and ensure perpetual contract prices match spot markets. It defines a mechanism by exchanges to ensure that future prices and index prices periodic payments regularly converge. When the funding rate is positive, the price of the perpetual contract is higher than the mark price. This means traders who are bullish and have opened long positions pay traders who are in short positions. On the other hand, a negative funding rate means perpetual prices are below the mark price, and hence traders with short positions pay traders who have opened long positions.
(The technical analysis of this story was written with the help of an AI tool.)
Author

John Isige
FXStreet
John Isige is a seasoned cryptocurrency journalist and markets analyst committed to delivering high-quality, actionable insights tailored to traders, investors, and crypto enthusiasts. He enjoys deep dives into emerging Web3 tren