Solana Price Forecast: Institutional inflows and bullish metrics signal upside potential
- Solana price holds firm above a previously broken consolidation zone, hinting at an upside move ahead.
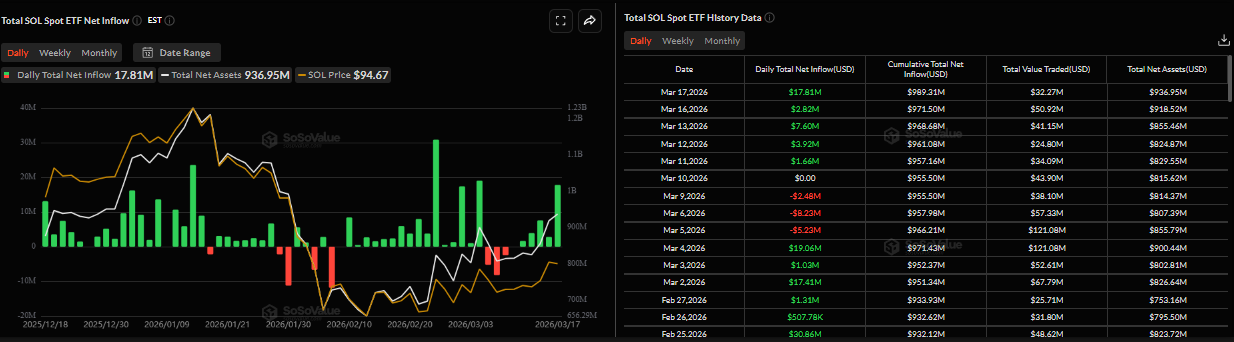
- US-listed spot SOL ETFs recorded an inflow of $17.81 million on Tuesday, marking the fifth consecutive day of inflow since March 10.
- On-chain and derivatives data back the bullish sentiment with rising social dominance and increasing long positioning among traders.

Solana (SOL) is showing signs of strength, trading at $94 on Wednesday as it holds above a key support zone following a recent breakout. Institutional demand supports SOL’s price action, as spot Exchange Traded Funds (ETFs) recorded inflows of over $17 million. Meanwhile, improving conditions in the on-chain and derivatives markets hint that SOL is gearing up for an upside move in the upcoming days.
Institutional demand supports SOL
Institutional demand for Solana began the week on a positive note. SoSoValue data shows that spot SOL ETFs recorded an inflow of $17.81 million on Tuesday after a $2.82 million inflow in the previous day. Tuesday’s positive flows marked the fifth consecutive day of inflow since March 10, highlighting growing investor interest. If this inflow trend continues and intensifies, SOL could see an upside move in the upcoming days.
On-chain and derivatives data back bullish sentiment
Santiment’s Social Dominance metric for Solana supports a positive outlook. The index measures the share of SOL-related discussions across the cryptocurrency media. It has been in an upward trend since mid-March, reading 1.36% on Wednesday, the highest level since January 19. This rise indicates growing market interest and strengthening sentiment among SOL investors.
 [09-1773810969911-1773810969923.27.52, 18 Mar, 2026].png)
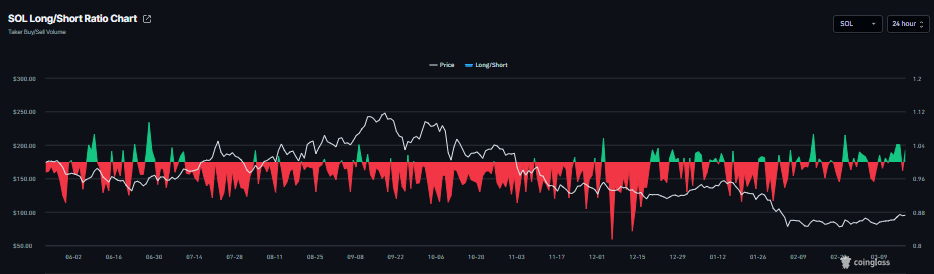
On the derivatives side, CoinGlass’s long-to-short ratio for SOL reads 1.02 on Wednesday. This ratio, being above one, shows that the majority of traders are betting on the asset’s price to rally.
Solana Price Forecast: SOL breaks above key resistance zones
Solana price is trading at $95 on Wednesday. The near-term bias is cautiously bullish after the price broke above the descending resistance trendline near $93.62 and the upper boundary of the parallel channel capped around $92.11 earlier this week.
Momentum has improved, with the Relative Strength Index (RSI) on the daily chart holding close to 60 and the Moving Average Convergence Divergence (MACD) line staying above its signal line in positive territory, suggesting strengthening upside pressure despite the SOL price remaining below the declining 100-day Exponential Moving Average near $110.
The move above the 23.6% Fibonacci retracement at $86.60, measured from the $67.50 low to the $148.44 high, underscores a recovery from prior weakness and tilts the short-term structure away from the earlier downtrend.
Immediate support is now seen at the former channel top near $92.10, followed by the 23.6% retracement at $86.60 and then the channel base around $77.10. As long as SOL holds above this support stack, buyers would retain control of the short-term setup.
On the upside, initial resistance emerges at the 38.2% Fibonacci retracement at $98.42. A sustained break above this level would expose the 50% retracement at $107.97, ahead of the psychological horizontal barrier and prior congestion near $120.00, where the 100-day EMA also converges, forming a broader resistance area.
-1773811066707-1773811066708.png)
(The technical analysis of this story was written with the help of an AI tool.)
Author

Manish Chhetri
FXStreet
Manish Chhetri is a crypto specialist with over four years of experience in the cryptocurrency industry.



