Solana Price Analysis: SOL eyes bullish breakout as institutional demand holds strong
- Solana hovers above $90 on Monday, preparing for a bullish exit from over a month-long consolidation.
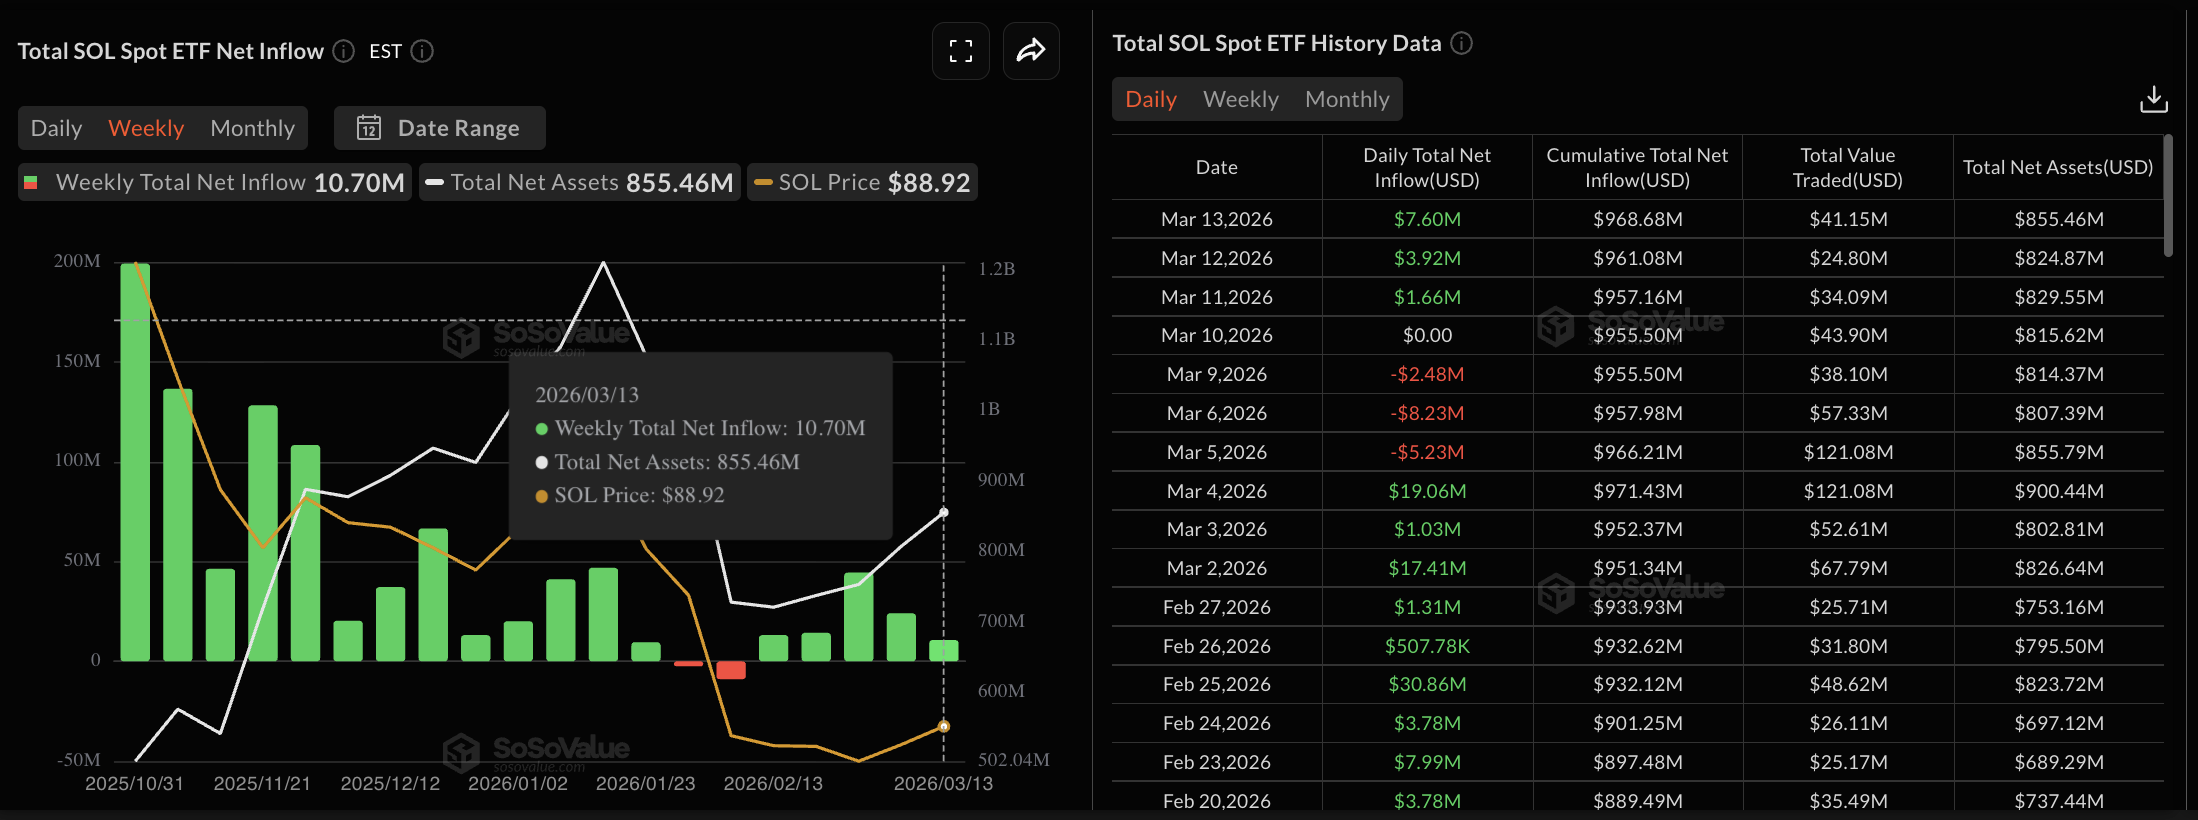
- Institutional demand for Solana holds steady with $10.70 million in inflows last week.
- The technical outlook for Solana is cautiously optimistic, though the declining 50-day EMA adds to downside pressure.

Solana (SOL) edges higher above $90 at press time on Monday, after a 13% rise the previous week. Institutional and retail demand for Solana holds strong, evidenced by rising inflows and Open Interest. The technical outlook for SOL focuses on the 50-day EMA as the immediate resistance, capping the upside above $100.
Rising ETF inflows support Solana's recovery
Solana retained its institutional interest as SOL-focused Exchange Traded Funds (ETFs) recorded a $7.60 million inflow on Friday, pushing its weekly netflow to $10.70 million. Consistent ETF inflows suggest strong institutional demand, which could help dampen downside pressure.
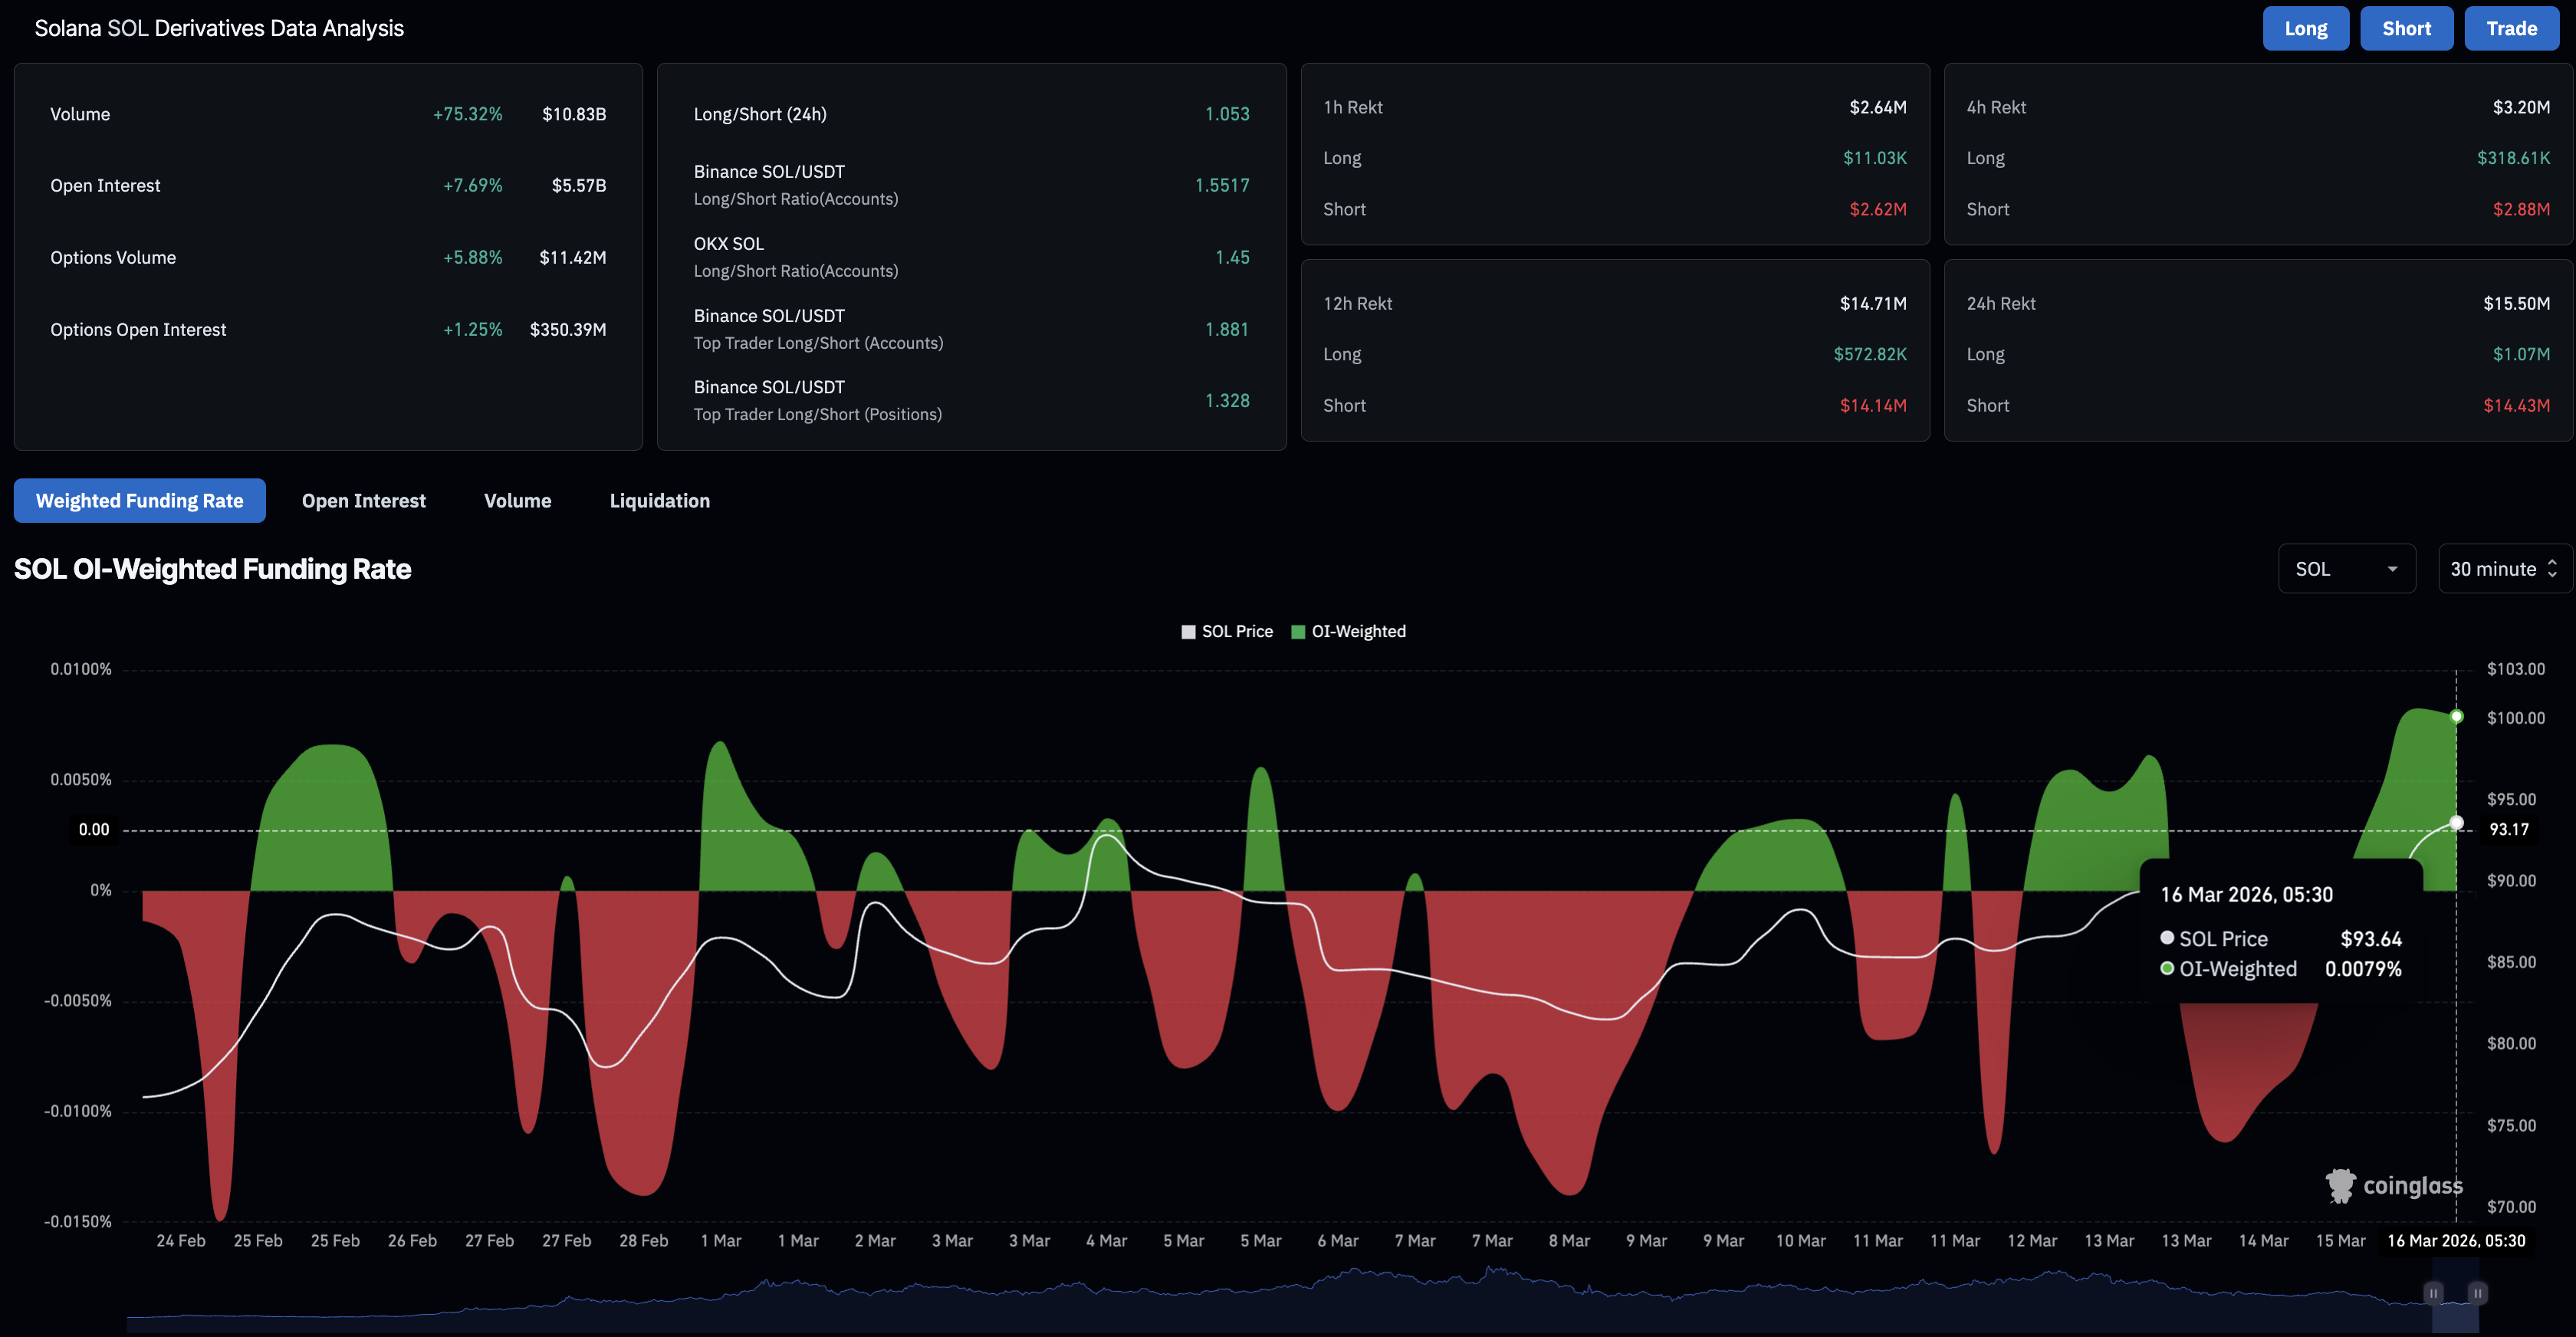
Meanwhile, the retail interest in Solana is catching up with the institutional confidence. CoinGlass data shows that SOL futures Open Interest (OI) is up by more than 7% over the last 24 hours, reaching $5.57 billion, suggesting a significant buildup of fresh or higher leveraged positions.
Amid capital inflows into the Solana futures market, liquidation data shows a wipeout of bearish positions. Solana futures recorded $15.50 million of liquidations in the last 24 hours, led by $14.43 million of short liquidations, reflecting the unwinding of mainly bearish positions.
Technical outlook: Will Solana rise above $100?
Solana extends gains at press time on Monday, after nearly 5% gains on the previous day. The recovery in SOL edges above the February 5 open price of $92.11, which acts as an upper ceiling of a consolidation range, while the February 5 close price at $78.35 serves as the bottom support.
The mild recovery shows an upside breakout chance but remains capped well below the descending 50-day Exponential Moving Average (EMA) at $94.17. A decisive close above this average could expose a higher target at the 100-day EMA at $109.58.
The Moving Average Convergence Divergence (MACD) enters positive territory, while the histogram widens, suggesting improving upside momentum. The Relative Strength Index (RSI) at 58 rises above the midline, reinforcing a near-term bullish bias.
On the downside, a bearish close to the day could trigger a reversal within the consolidation range, testing the $78.35 base floor.
(The technical analysis of this story was written with the help of an AI tool.)
Author

Vishal Dixit
FXStreet
Vishal Dixit holds a B.Sc. in Chemistry from Wilson College but found his true calling in the world of crypto.



