![]() Sarah Tran
Sarah Tran
Independent Analyst
- Shiba Inu price is at a critical point as it inches closer to a massive bull run.
- The Dogecoin-killer needs to break above $0.00003037 for SHIB to reach the optimistic target of a 42% climb.
- However, a slice below $0.00002879 could spell trouble for the bulls.
Shiba Inu price appears to be consolidating following its tremendous rally of over 340% in early October to a swing high of $0.00003528. SHIB has presented a continuation pattern and is nearly at the brink of a make-or-break point. If the Dogecoin-killer manages to slice above a crucial level of resistance, it could anticipate a rally of 42%.
Shiba Inu price eyes ascent toward $0.00004346
Shiba Inu price has formed a symmetrical triangle on the 4-hour chart, indicating that the bulls may be catching their breath following the massive uptrend. While SHIB is confusing investors with directional cues, its next move could indicate a 42% ascent depending on whether the token manages to slice above a critical hurdle.
Investors should note that the bullish target would only be on the radar if Shiba Inu price breaks above the upper boundary of the triangle pattern at $0.00003037. Only if SHIB manages to escape above the aforementioned resistance, would the prevailing chart pattern project a 42% ascent toward $0.00004346, coinciding with the 127.2% Fibonacci retracement level.
However, Shiba Inu price may face a few obstacles before reaching the optimistic target. The first hurdle above the topside trend line of the triangle emerges at $0.00003073, the October 13 high. Additional obstacles may arise at $0.00003200 and $0.00003528, the October 11 high and October 7 high, respectively.
The Momentum Reversal Indicator (MRI) also presents a breakout line at $0.00003559, which indicates that this area would be crucial to crack before Shiba Inu price could climb toward its aforementioned bullish target.
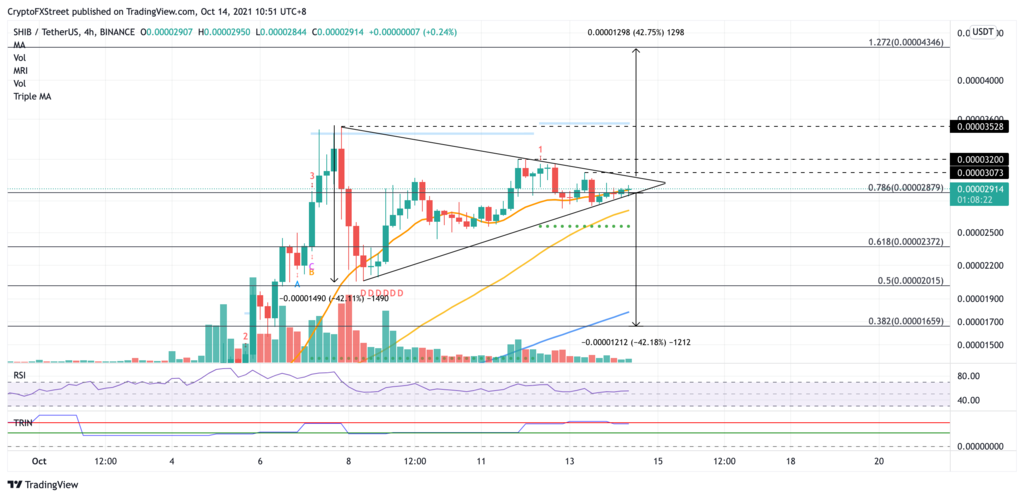
SHIB/USDT 4-hour chart
If Shiba Inu faces a spike in sell orders, SHIB may resort to its first line of defense at the 20 four-hour Simple Moving Average (SMA) at $0.00002879, coinciding with the 78.6% Fibonacci retracement level. Investors should also note that a slice below this level could put the token in danger of a 42% decline toward $0.00001659, coinciding with the 28.2% Fibonacci retracement level, given by the prevailing chart pattern.
However, additional support may appear at the 50 four-hour SMA at $0.00002712, then at the support line given by the MRI at $0.00002562. Further lines of defense will emerge at $.0.00002372, $0.00002015 and $0.00001784, the 61.8% Fibonacci retracement level, the 50% Fibonacci retracement level and the 100 four-hour SMA, respectively.
Note: All information on this page is subject to change. The use of this website constitutes acceptance of our user agreement. Please read our privacy policy and legal disclaimer. Opinions expressed at FXstreet.com are those of the individual authors and do not necessarily represent the opinion of FXstreet.com or its management. Risk Disclosure: Trading foreign exchange on margin carries a high level of risk, and may not be suitable for all investors. The high degree of leverage can work against you as well as for you. Before deciding to invest in foreign exchange you should carefully consider your investment objectives, level of experience, and risk appetite. The possibility exists that you could sustain a loss of some or all of your initial investment and therefore you should not invest money that you cannot afford to lose. You should be aware of all the risks associated with foreign exchange trading, and seek advice from an independent financial advisor if you have any doubts.
Recommended Content
Editors’ Picks
Ethereum dips slightly amid Renzo depeg, BlackRock spot ETH ETF amendment

Ethereum (ETH) suffered a brief decline on Wednesday afternoon despite increased accumulation from whales. This follows Ethereum restaking protocol Renzo restaked ETH (ezETH) crashing from its 1:1 peg with ETH and increased activities surrounding spot Ethereum ETFs.
Injective price weakness persists despite over 5.9 million INJ tokens burned
Injective (INJ) price is trading with a bearish bias, stuck in the lower section of the market range. The bearish outlook abounds despite the network's deflationary efforts to pump the price. Coupled with broader market gloom, INJ token’s doomed days may not be over yet.
US intensifies battle against crypto privacy protocols following crackdown on Samourai Wallet

CEO Keonne Rodriguez and CTO William Lonergan of Samourai Wallet were arrested by the US Department of Justice (DoJ) on Wednesday and charged with $100 million in money laundering on a count and illegal money transmitting on another count. This move could see privacy-focused cryptocurrencies take a dip.
Near Protocol Price Prediction: NEAR fulfills targets but a 10% correction may be on the horizon
Near Protocol price has completed a 55% mean reversal from the bottom of the market range at $4.27. Amid growing bearish activity, NEAR could drop 10% to the $6.00 psychological level before a potential recovery. A break and close above $7.95 would invalidate the downleg thesis.
Bitcoin: BTC post-halving rally could be partially priced in Premium

Bitcoin (BTC) price briefly slipped below the $60,000 level for the last three days, attracting buyers in this area as the fourth BTC halving is due in a few hours. Is the halving priced in for Bitcoin? Or will the pioneer crypto note more gains in the coming days?