Ripple's XRP Technical Analysis: XRP/USD saved by a double bottom
- Ripple's XRP was nursing losses of just 2.5%, after initially being under heavy pressure early on Tuesday.
- XRP/USD produced a double bottom pattern, seeing big buying come back in to stop price further falling.
- Buyers heavily defended a free-fall, a breach of $0.4100 could have exposed XRP/USD to drop down to 0.30-0.25 area.

XRP/USD 4-hour chart
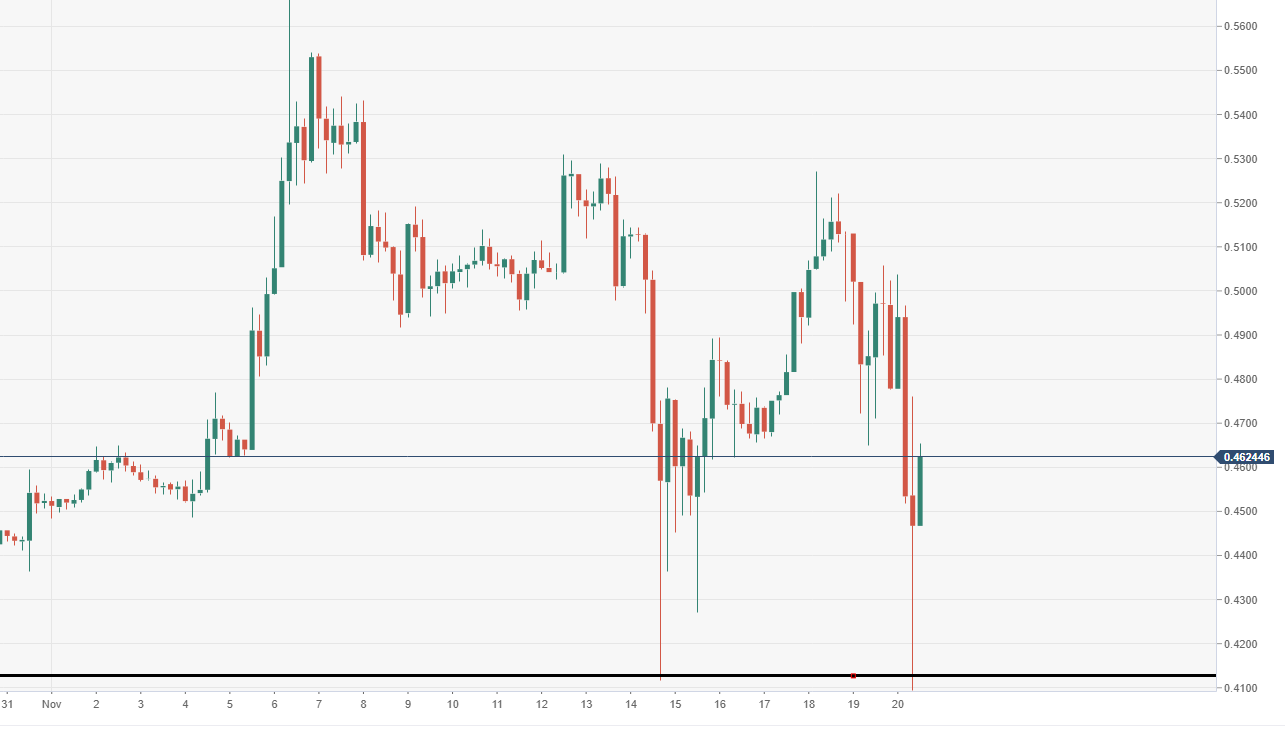
Spot rate: 0.4626
Relative change: -2.55%
High: 0.5036
Low: 0.4097
Trend: Bearish
Support 1: 0.4575, daily pivot point support.
Support 2: 0.4372, lower support of channel.
Support 3: 0.4094, daily pivot point support.
Resistance 1: 0.5056, daily pivot point resistance.
Resistance 2: 0.5334, daily pivot point resistance.
Resistance 3: 0.5537, daily pivot point resistance.
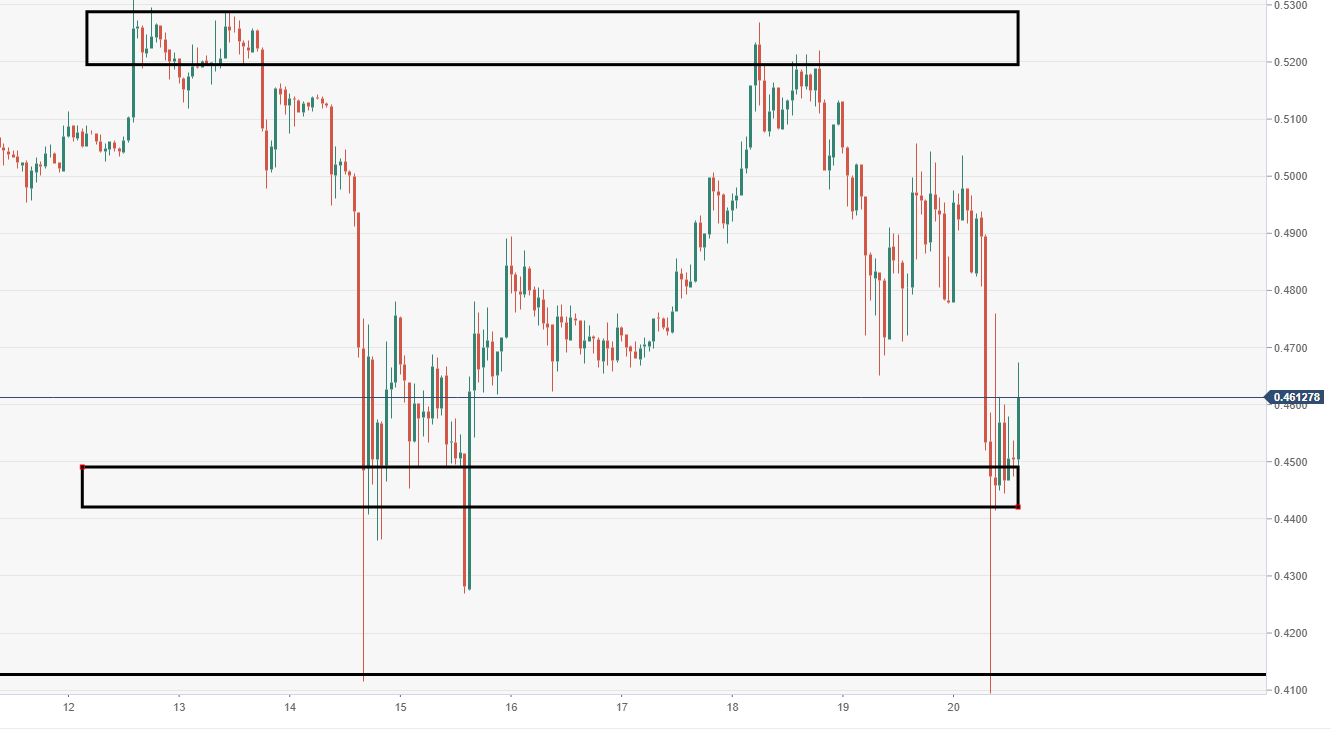
XRP/USD 60-minute chart
- XRP/USD demand area providing some bidding arround $0.44-45 area. Supply tough within $0.52 territory.
Author

Ken Chigbo
Independent Analyst
Ken has over 8 years exposure to the financial markets. He started his career as an analyst, covering a variety of asset classes; forex, fixed income, commodities and equities.


