XRP extends recovery on renewed ETF inflows
- XRP gains momentum with the short-term $1.10 support holding on Friday.
- XRP experiences a resurgence of inflows into US-listed ETFs while futures Open Interest rises only marginally to 2.2 billion XRP.
- XRP flaunts a positive near-term technical picture, buoyed by momentum indicators and key moving average support.

Ripple (XRP) exhibits strong recovery prospects, trading above $1.10 on Friday. This rebound aligns with the broader crypto market and can be attributed to easing geopolitical tensions in the Middle East and growing appetite for risk assets.
Improving sentiment lifts XRP demand
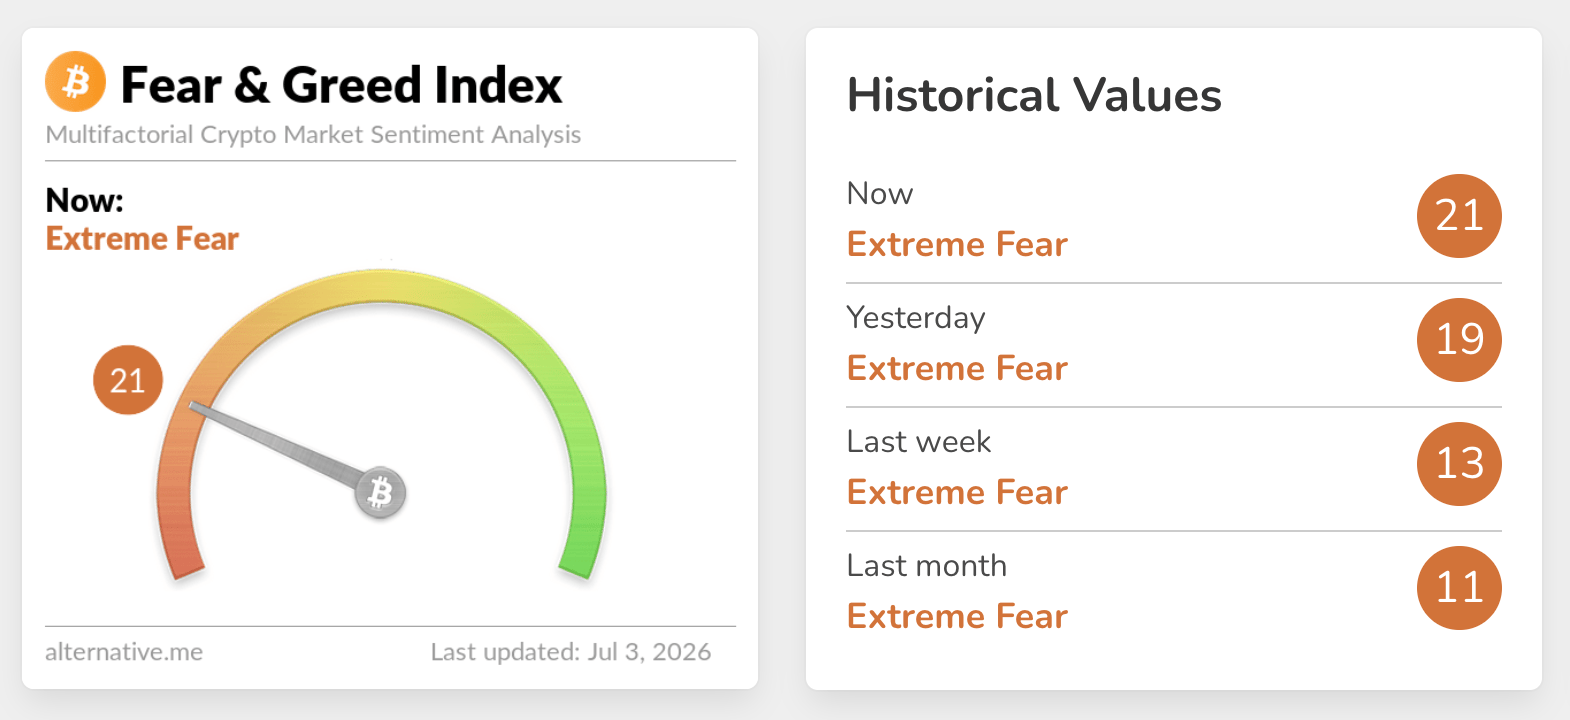
Appetite for XRP digital investment products has strengthened, supported by improvement in sentiment across the cryptocurrency market, as evidenced by the Fear and Greed Index. Current data shows the index embedded in the Extreme Fear territory at 21 on Friday, up only slightly from 19 the day before and significantly higher than June’s average of 11.
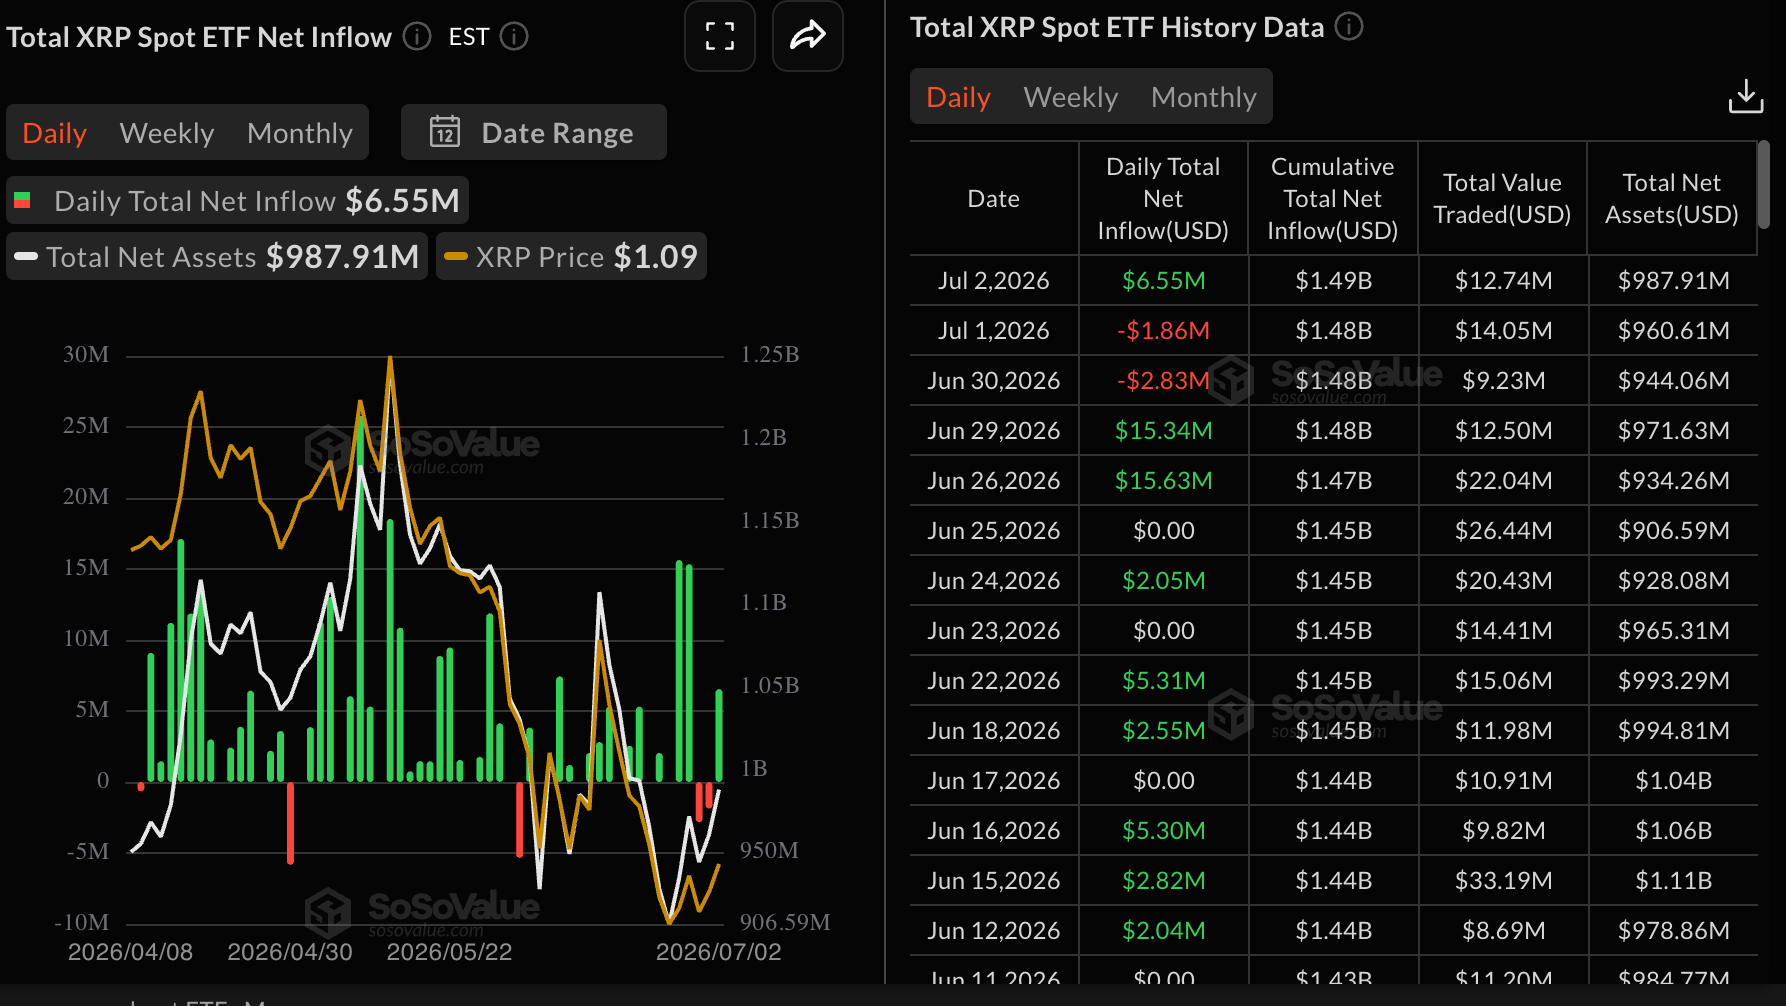
Renewed interest in XRP spot Exchange-Traded Funds (ETFs) reinforces the broader market sentiment. After two consecutive days of outflows, inflows resumed on Thursday at nearly $7 million. Overall, demand for ETFs has remained relatively steady, given cumulative inflows now stand at $1.49 billion, up from $1.43 billion on June 1. Total assets under management average $988 million.
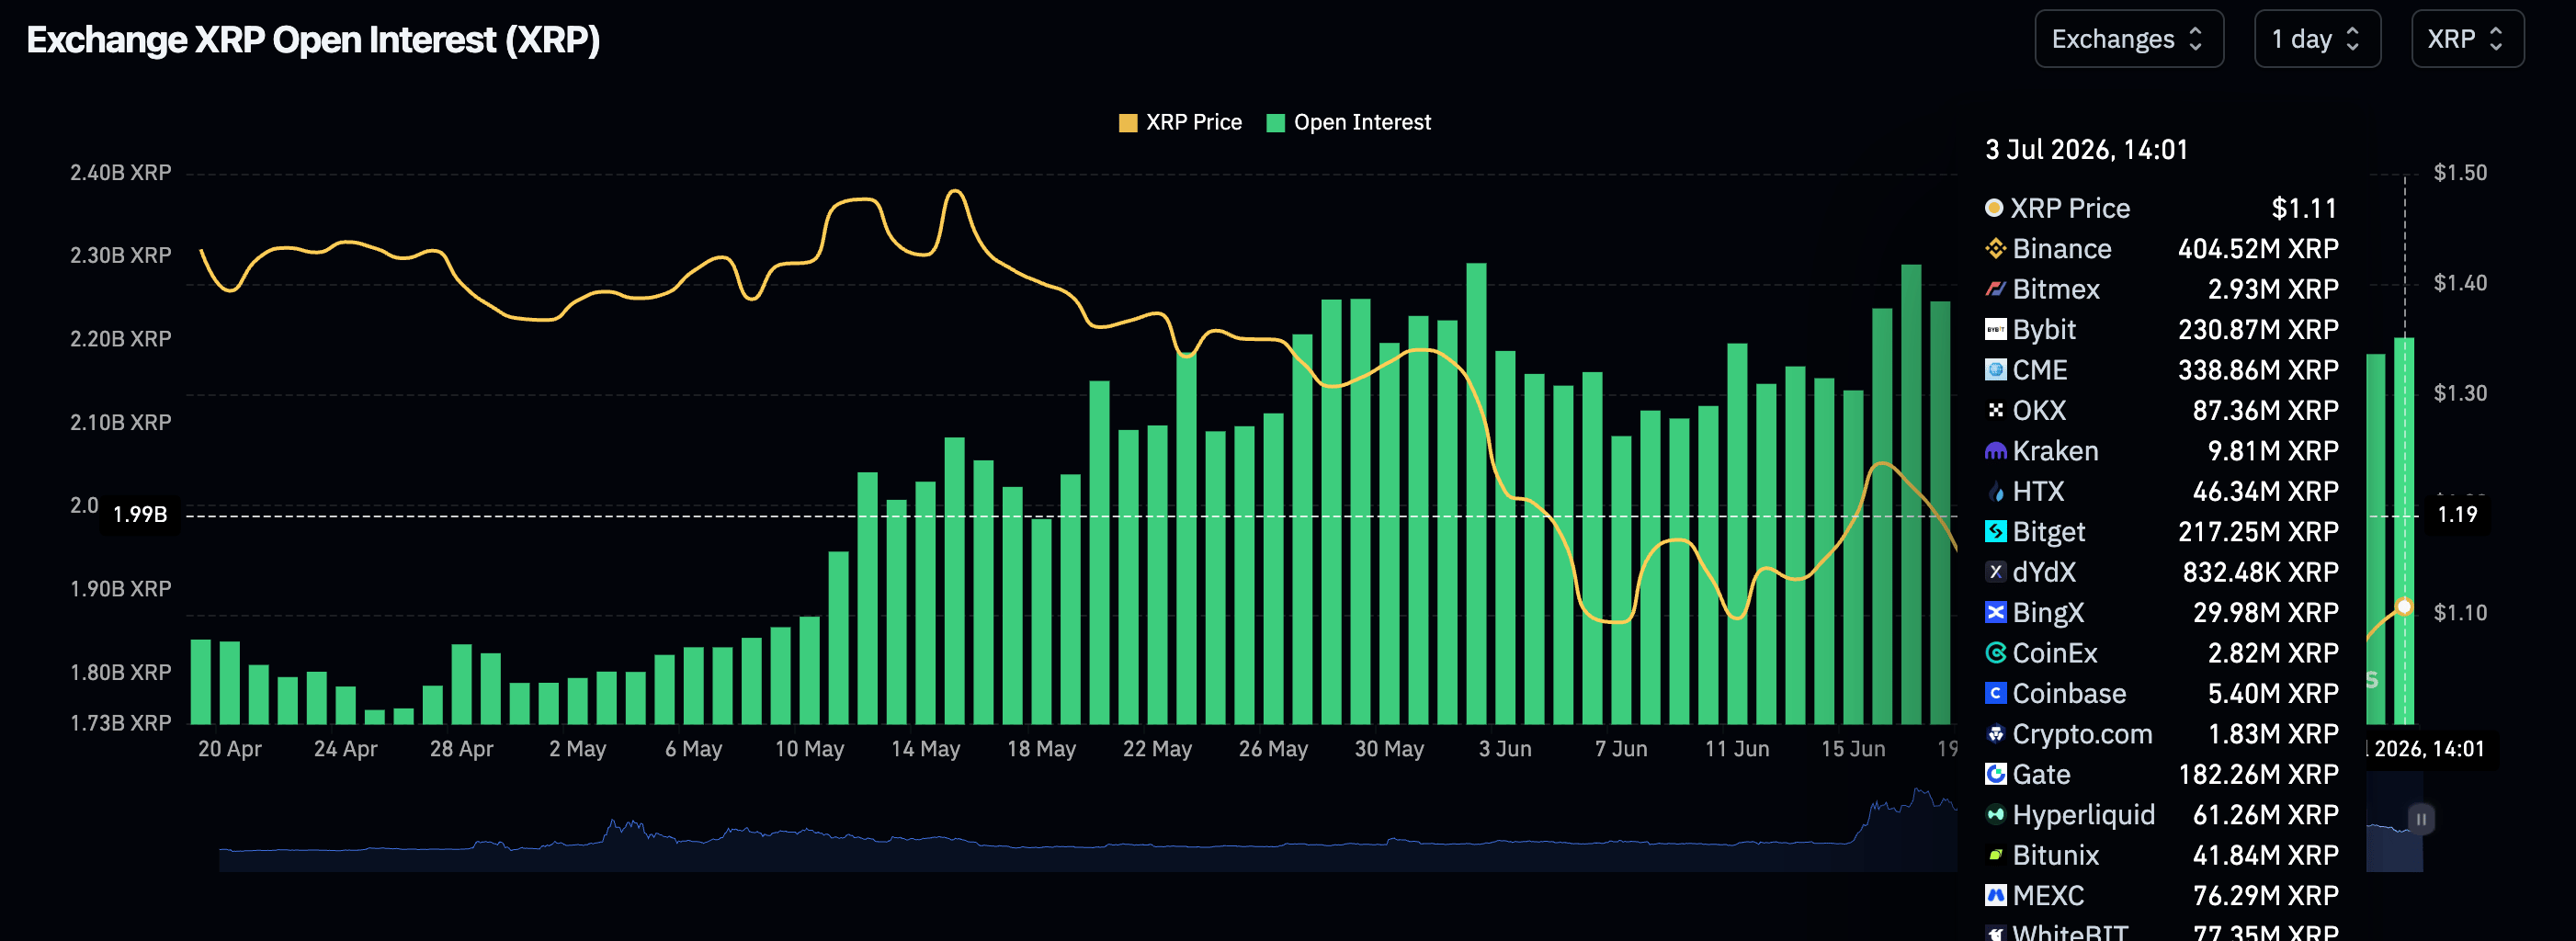
Retail demand also shows marginal improvement, as perpetual futures Open Interest (OI) expands to 2.2 billion XRP on Friday, up from 2.18 billion XRP the previous day.
Despite the mild increase, CoinGlass data shows that the OI holds below the June peak of 2.28 billion XRP. This implies that steady retail demand is critical to stabilizing XRP’s short- to medium-term outlook.
Price analysis: XRP reinforces short-term recovery
XRP extends its recovery above $1.10, reflecting growing interest in the token that swept liquidity at the $1.03 support earlier in the week. The short-term technical outlook upholds a constructive bullish bias as the spot price stands above the 50-day and 100-day Exponential Moving Averages (EMAs) at $1.07 and $1.09, while also remaining well supported by the Bollinger Bands middle layer near $1.06.
The upper Bollinger Band at $1.11 sits just above spot as immediate resistance, hinting at a market pressing against the upper volatility envelope.
Meanwhile, the Moving Average Convergence Divergence (MACD) histogram stays positive and gently expanding on the daily chart, with the MACD line above the signal line, reinforcing steady upside momentum. At the same time, the Relative Strength Index (RSI) hovers in the mid-60s on the same chart, suggesting firm bullish pressure without yet entering overbought territory.
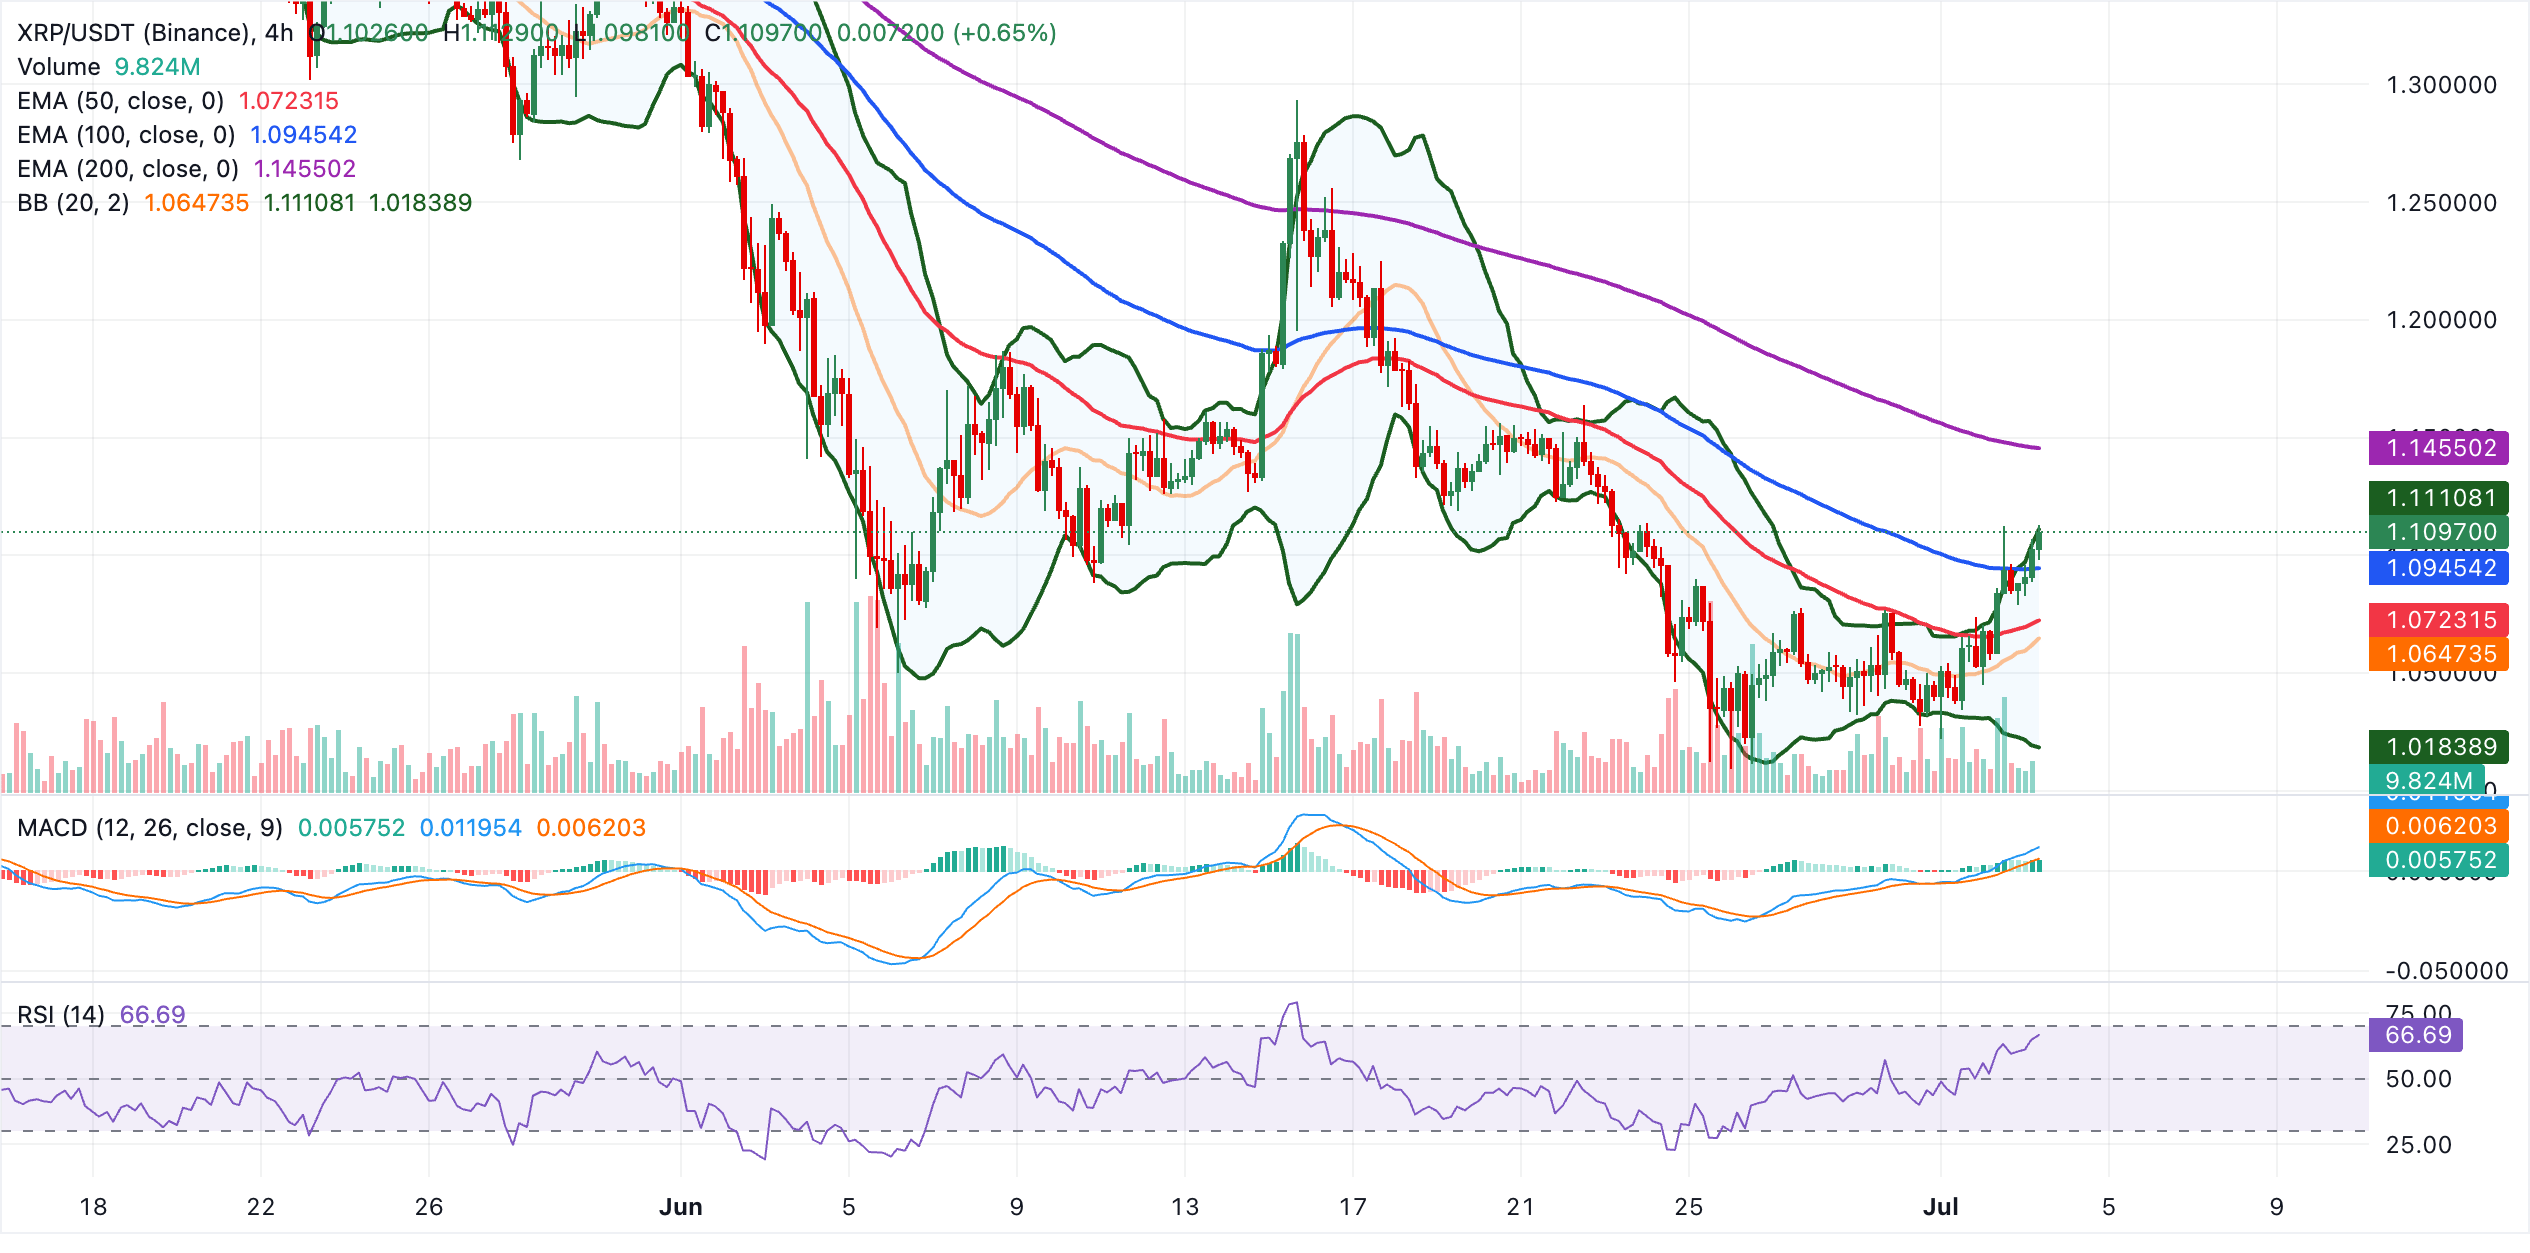
Initial resistance is aligned at the upper Bollinger Band around $1.11. A break of which would expose the more significant 200-day EMA near $1.14 as the next upside barrier. On the flip side, the first area of demand emerges at the 100-day EMA around $1.09, followed by layered support from the 50-day EMA and the Bollinger midline band clustered between roughly $1.07 and $1.06, with the lower Bollinger Band far below at $1.02 acting as a deeper downside cushion if a sharper correction unfolds.
(The technical analysis of this story was written with the help of an AI tool.)
Bitcoin, altcoins, stablecoins FAQs
Bitcoin is the largest cryptocurrency by market capitalization, a virtual currency designed to serve as money. This form of payment cannot be controlled by any one person, group, or entity, which eliminates the need for third-party participation during financial transactions.
Altcoins are any cryptocurrency apart from Bitcoin, but some also regard Ethereum as a non-altcoin because it is from these two cryptocurrencies that forking happens. If this is true, then Litecoin is the first altcoin, forked from the Bitcoin protocol and, therefore, an “improved” version of it.
Stablecoins are cryptocurrencies designed to have a stable price, with their value backed by a reserve of the asset it represents. To achieve this, the value of any one stablecoin is pegged to a commodity or financial instrument, such as the US Dollar (USD), with its supply regulated by an algorithm or demand. The main goal of stablecoins is to provide an on/off-ramp for investors willing to trade and invest in cryptocurrencies. Stablecoins also allow investors to store value since cryptocurrencies, in general, are subject to volatility.
Bitcoin dominance is the ratio of Bitcoin's market capitalization to the total market capitalization of all cryptocurrencies combined. It provides a clear picture of Bitcoin’s interest among investors. A high BTC dominance typically happens before and during a bull run, in which investors resort to investing in relatively stable and high market capitalization cryptocurrency like Bitcoin. A drop in BTC dominance usually means that investors are moving their capital and/or profits to altcoins in a quest for higher returns, which usually triggers an explosion of altcoin rallies.
Author

John Isige
FXStreet
John Isige is a seasoned cryptocurrency journalist and markets analyst committed to delivering high-quality, actionable insights tailored to traders, investors, and crypto enthusiasts. He enjoys deep dives into emerging Web3 tren




