XRP extends sideways action amid muted retail and institutional interest
- XRP hovers around the $1.40 supply zone, upholding modest gains despite softening demand.
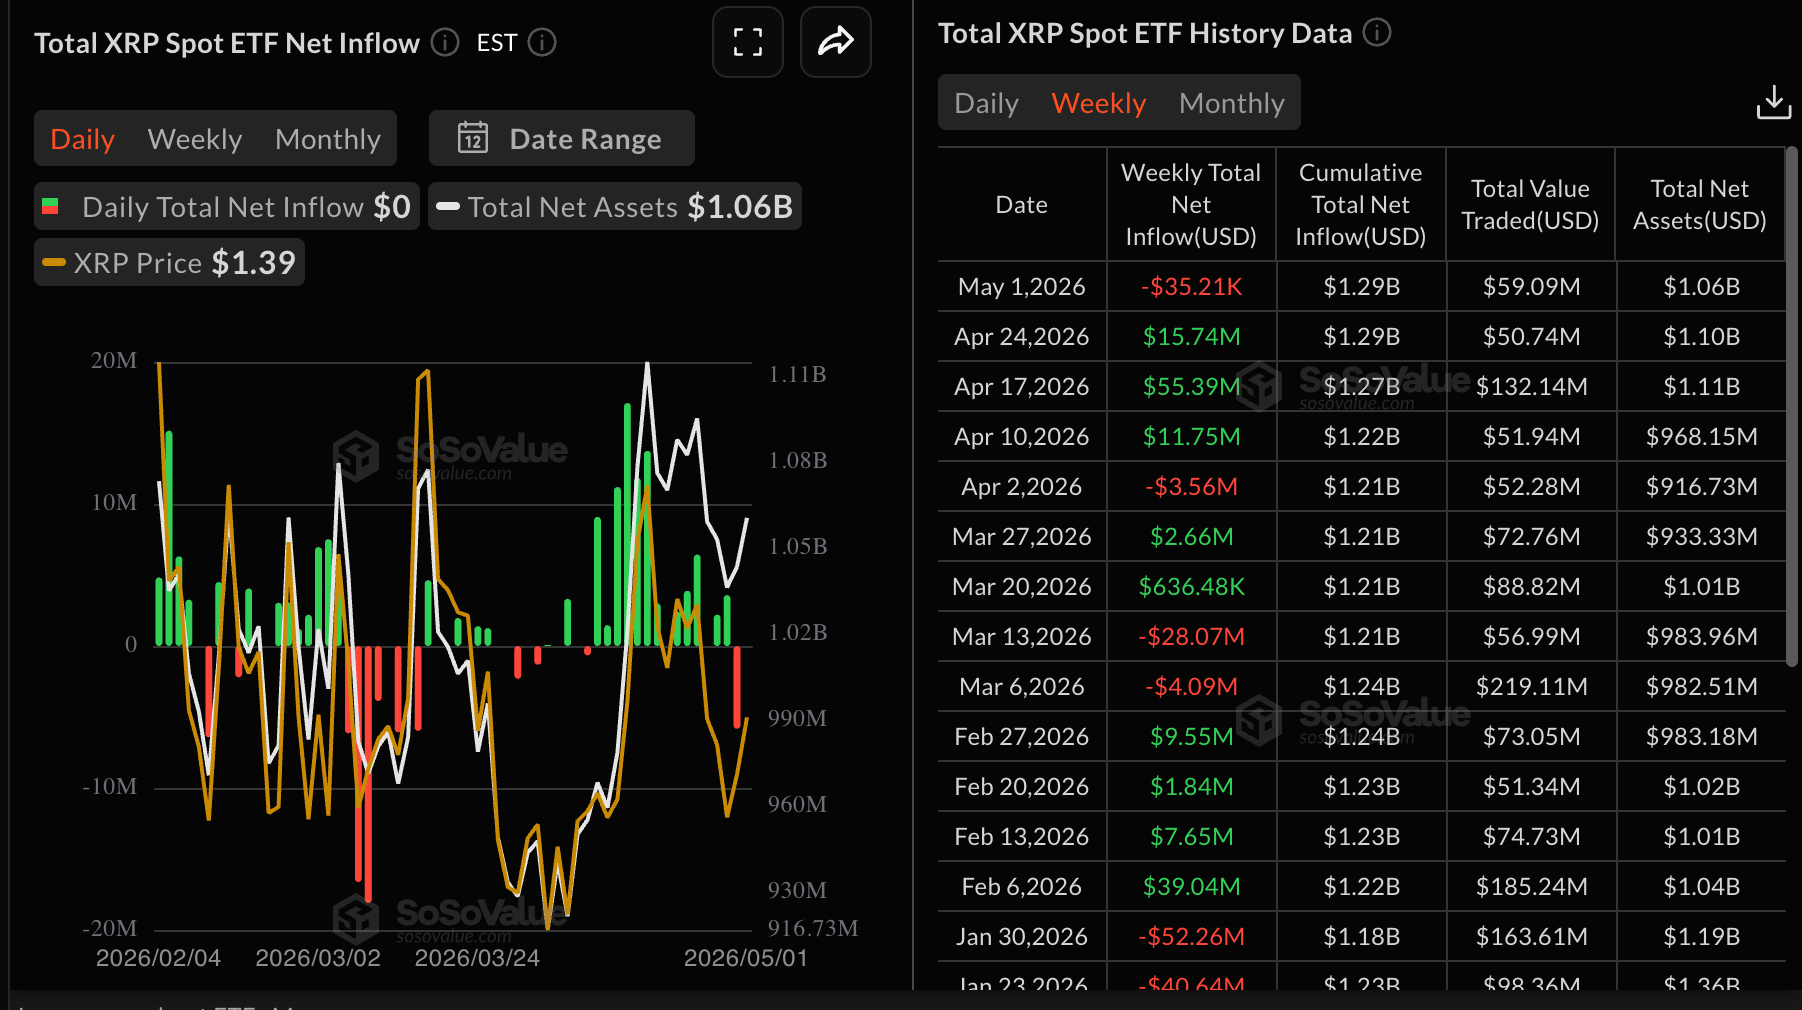
- US-listed XRP spot ETFs logged mild outflows last week as institutional interest cooled.
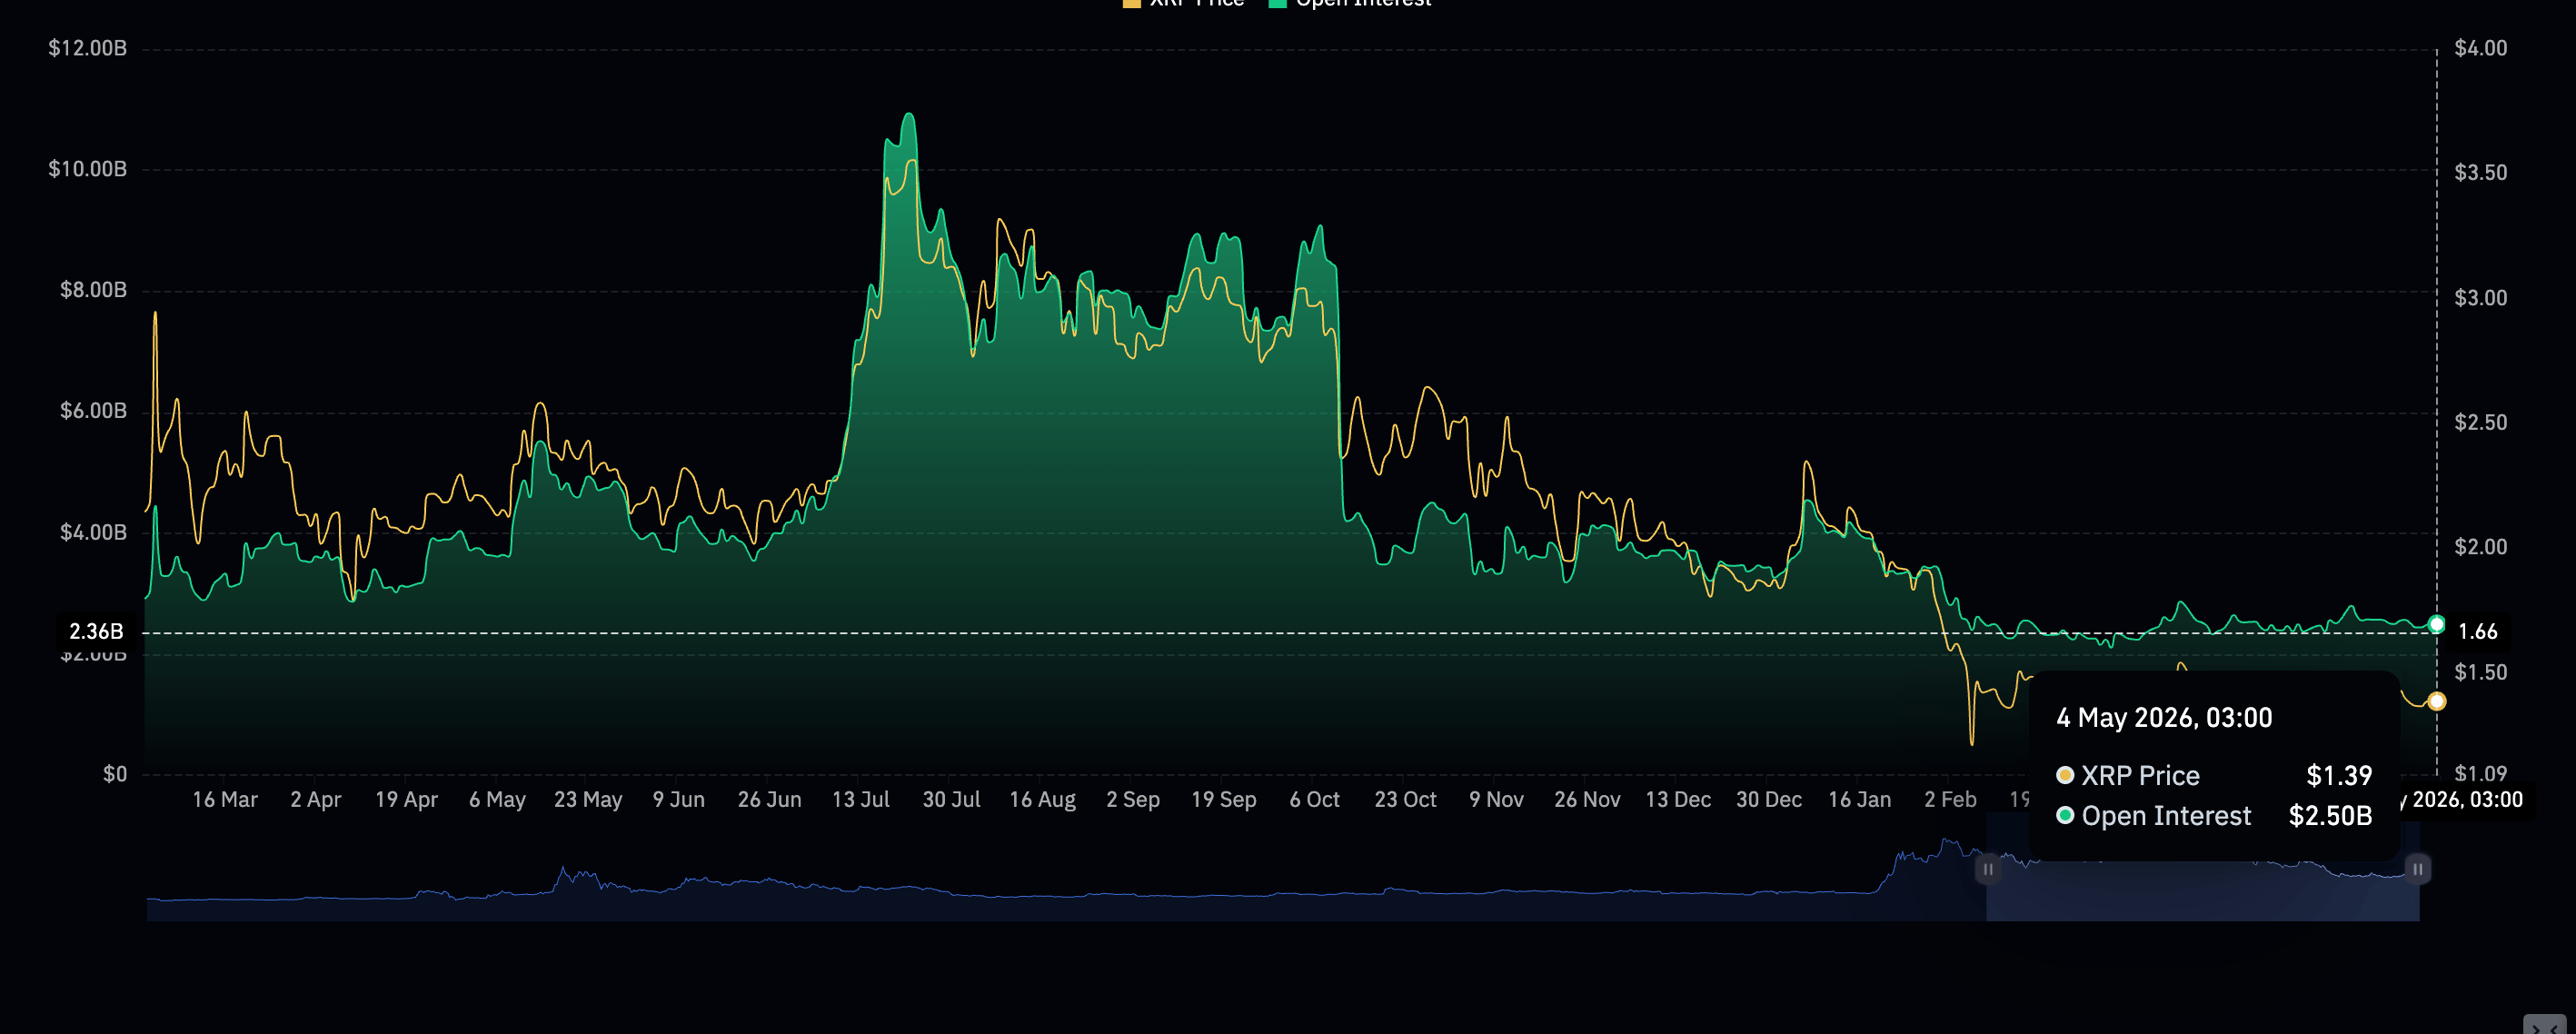
- Muted retail participation in XRP, with futures Open Interest holding at $2.50 billion on Monday, may cap the upside.

Ripple (XRP) upholds modest gains, trading around $1.40 at the time of writing on Monday. XRP largely remains rangebound between support at $1.30 and resistance at $1.40, reflecting a softening appetite for both digital investment products and derivatives.
Cooling demand caps XRP recovery
XRP derivative demand remains subdued, with futures Open Interest (OI) averaging $2.5 billion on Monday. This is a sharp contrast to the July peak of $10.94 billion, highlighting persistent skepticism among retail participants about XRP’s ability to maintain an uptrend over the short to medium term.
Turning to XRP spot Exchange-Traded Funds (ETFs), which logged outflows totaling $35,210 last week, signals softening interest in related digital investment products. SoSoValue data shows that cumulative inflows stand at $1.29 billion, with net assets averaging $1.06 billion.
Technical outlook: XRP sideways action persists
XRP trades at $1.39 as the price consolidates just under a dense band of moving-average resistance, keeping the near-term bias neutral to slightly bearish. The 50-day Exponential Moving Average (EMA) at $1.41 and the 20-day Bollinger middle band converging at the same level sit immediately overhead, suggesting rallies are being capped within the upper half of the recent volatility envelope.
Momentum is mixed, with the Relative Strength Index (RSI) hovering near the neutral 50 midline on the daily chart and the Moving Average Convergence Divergence (MACD) histogram slipping marginally into negative territory, hinting at a lack of directional conviction after the latest bounce.
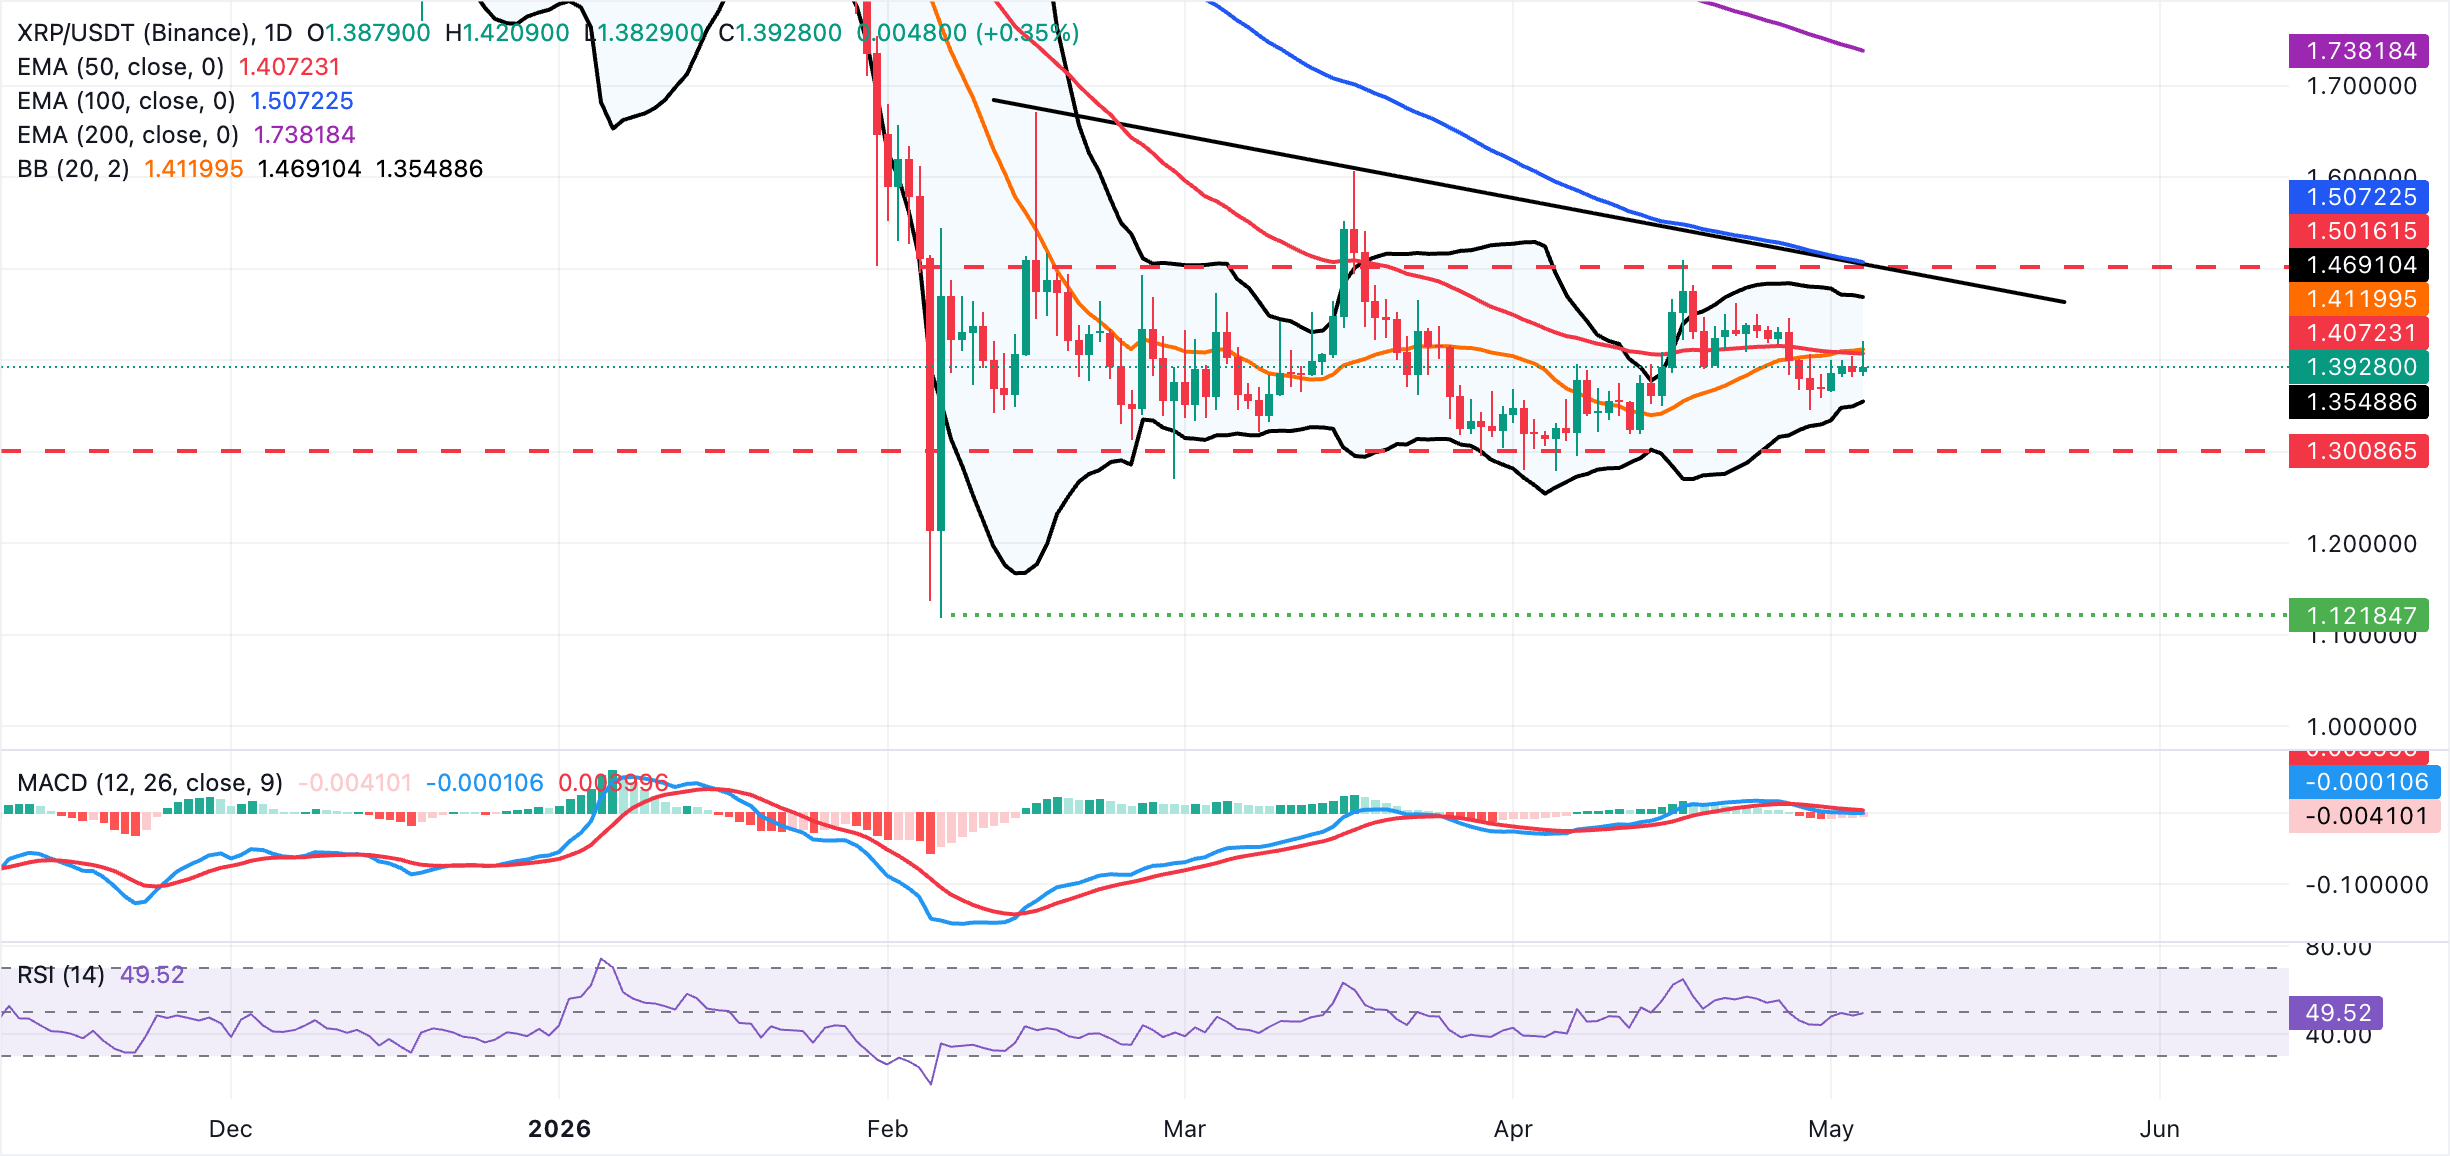
On the topside, initial resistance is at the 50-day EMA near $1.41, which aligns closely with the Bollinger midline boundary. Above that, the Bollinger upper band around $1.47 precedes a more strategic barrier at the descending trendline break level near $1.50, with the 100-day EMA at $1.50 reinforcing medium-term resistance. A sustained move through this cluster would open the way toward the 200-day EMA up at $1.74.
On the downside, immediate support is indicated by the Bollinger lower band around $1.36. A daily close below this level would signal that sellers are regaining control and could expose a deeper retracement within the broader range.
(The technical analysis of this story was written with the help of an AI tool.)
Open Interest, funding rate FAQs
Higher Open Interest is associated with higher liquidity and new capital inflow to the market. This is considered the equivalent of increase in efficiency and the ongoing trend continues. When Open Interest decreases, it is considered a sign of liquidation in the market, investors are leaving and the overall demand for an asset is on a decline, fueling a bearish sentiment among investors.
Funding fees bridge the difference between spot prices and prices of futures contracts of an asset by increasing liquidation risks faced by traders. A consistently high and positive funding rate implies there is a bullish sentiment among market participants and there is an expectation of a price hike. A consistently negative funding rate for an asset implies a bearish sentiment, indicating that traders expect the cryptocurrency’s price to fall and a bearish trend reversal is likely to occur.
Author

John Isige
FXStreet
John Isige is a seasoned cryptocurrency journalist and markets analyst committed to delivering high-quality, actionable insights tailored to traders, investors, and crypto enthusiasts. He enjoys deep dives into emerging Web3 tren


