XRP trends lower below key moving averages
- XRP remains below major averages, as pressure mounts on $1.35 short-term support.
- XRP reserves on the Binance exchange drop to 2.74 billion tokens on Thursday after peaking at 2.78 billion tokens in May.
- XRP ETFs post steady inflows totaling $12.57 million this week through Thursday but fail to lift price outlook.

Ripple (XRP) is trending lower toward the key $1.35 support level at the time of writing on Friday, following a failed attempt to break above $1.39 the previous day. Despite the dominant pressure, capital inflows continue through related digital investment products while investors appear intent on withdrawing their holdings from exchanges.
XRP ETF inflows stand out amid fading exchange reserves
Institutional interest in XRP has remained mild but steady this week, with total inflows into spot Exchange-Traded Funds (ETFs) averaging $12.57 million through Thursday. This marks the third consecutive week of inflows, reinforcing steady demand for US-listed XRP investment products. Meanwhile, Cumulative inflows stand at $1.39 billion, with net assets under management averaging $1.15 billion.
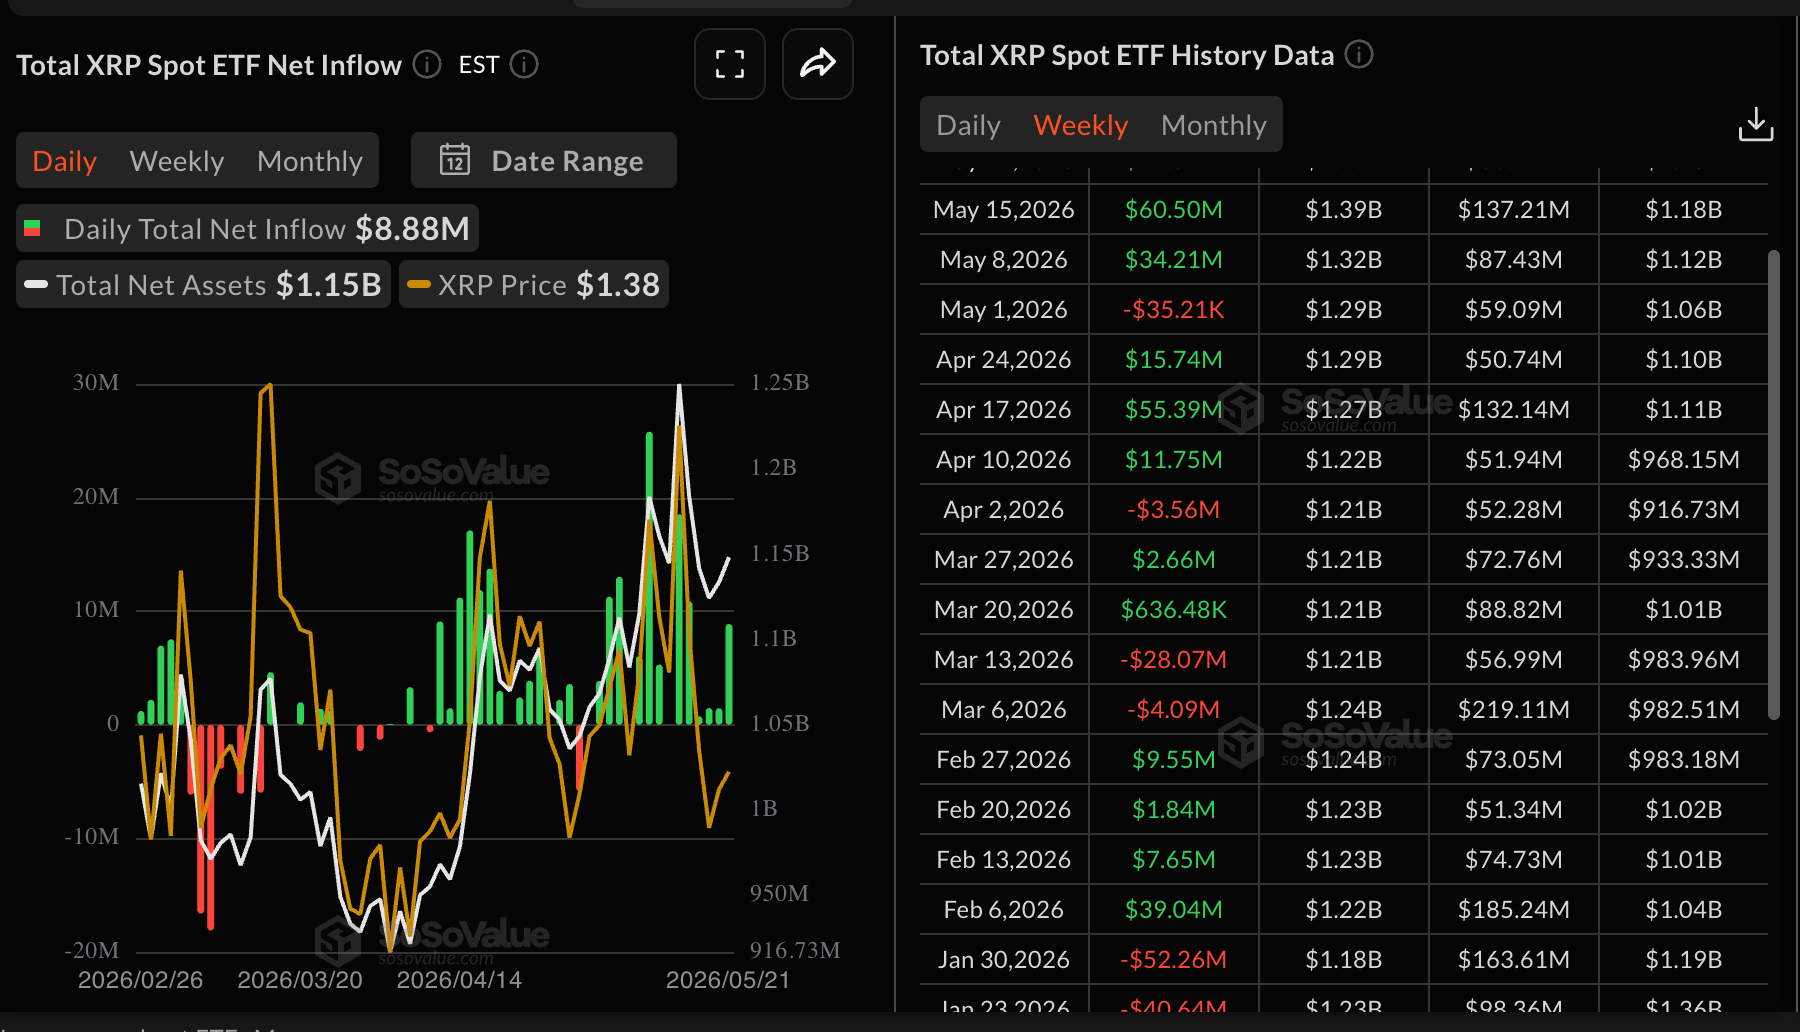
XRP holders, on the other hand, are increasingly withdrawing their assets from exchanges, as evidenced by the token’s balance on Binance falling to 2.74 billion on Thursday, from a May high of 2.78 billion. A decline in exchange reserves is typically viewed as bullish, since it limits the circulating supply available for sale and often indicates that investors are opting to hold XRP rather than trade it.
Price analysis: XRP holds key support
XRP trades at $1.36, maintaining a bearish near-term bias as price holds beneath the cluster of key moving averages. The 50-day Exponential Moving Average (EMA) at $1.41, the 100-day EMA at $1.48 and the 200-day EMA at $1.70 all sit overhead, suggesting rallies are likely to be capped while the pair trades below these trend barriers.
The Relative Strength Index (RSI) near 42 on the daily chart hints at lingering downside pressure without yet reaching oversold conditions. At the same time, the Moving Average Convergence Divergence (MACD) histogram remains below zero on the same chart, and its recent deterioration suggests momentum continues to favor sellers in the short term.
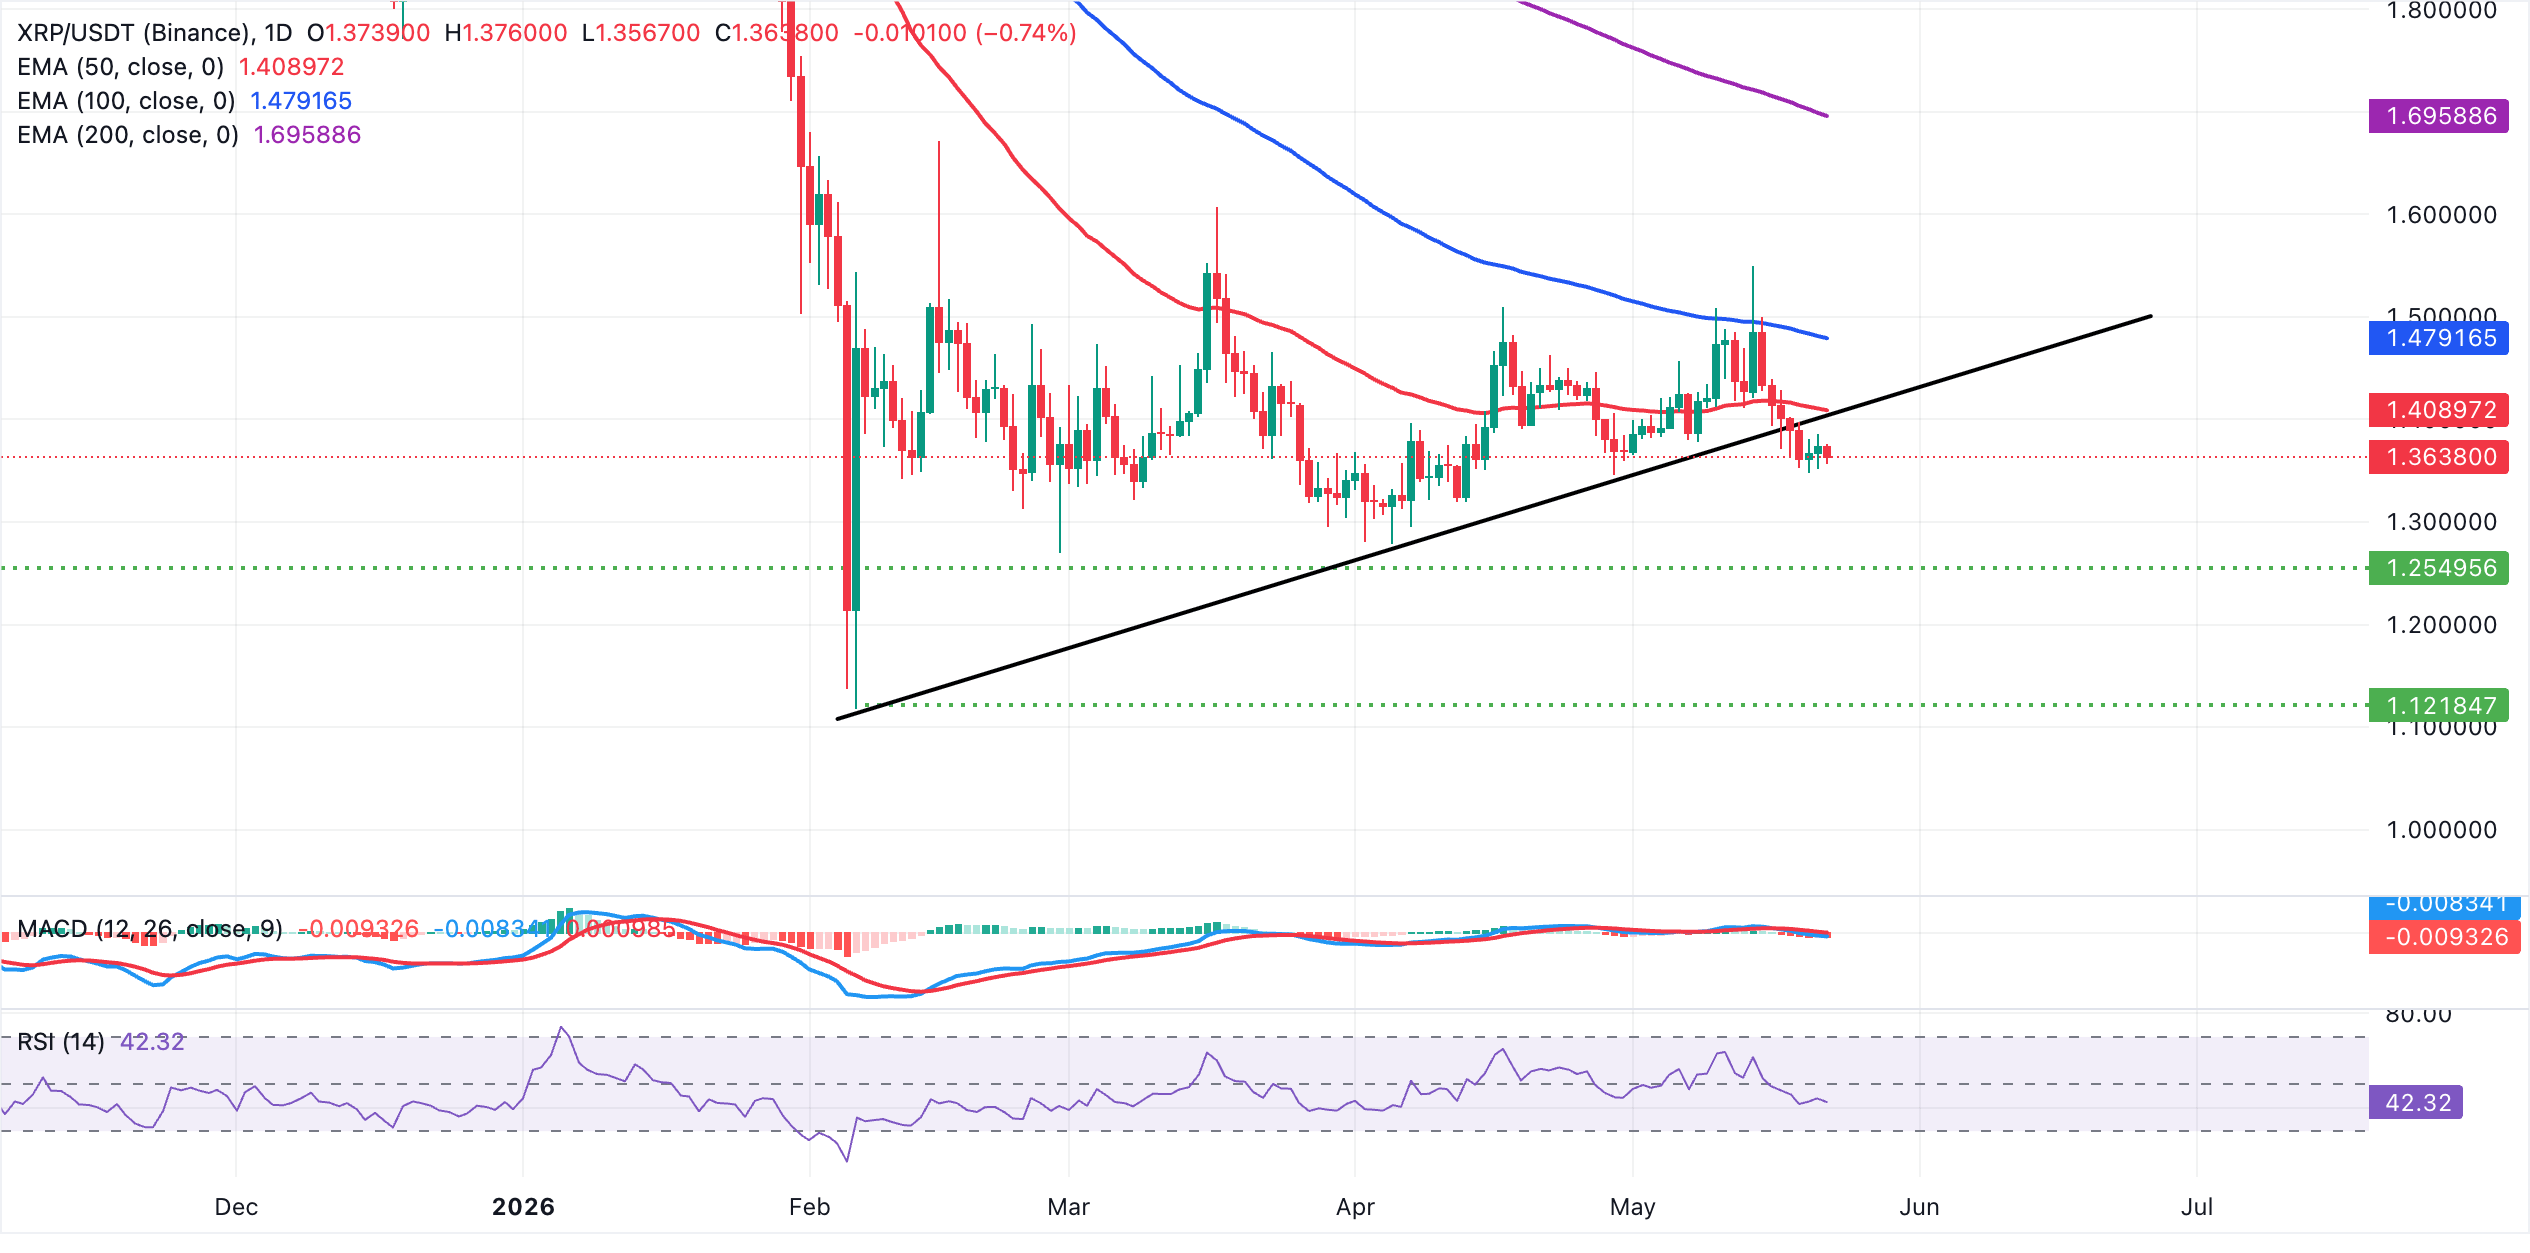
On the topside, immediate resistance lies at the former rising trendline around $1.41, coinciding with the 50-day EMA. Above that, the 100-day EMA at $1.48 marks the next significant barrier before the longer-term bearish cap at the 200-day EMA near $1.70. If XRP extends its decline below the near-term $1.35 support, the next key demand area lies at $1.30, where buyers could seek lower entries.
(The technical analysis of this story was written with the help of an AI tool.)
Bitcoin, altcoins, stablecoins FAQs
Bitcoin is the largest cryptocurrency by market capitalization, a virtual currency designed to serve as money. This form of payment cannot be controlled by any one person, group, or entity, which eliminates the need for third-party participation during financial transactions.
Altcoins are any cryptocurrency apart from Bitcoin, but some also regard Ethereum as a non-altcoin because it is from these two cryptocurrencies that forking happens. If this is true, then Litecoin is the first altcoin, forked from the Bitcoin protocol and, therefore, an “improved” version of it.
Stablecoins are cryptocurrencies designed to have a stable price, with their value backed by a reserve of the asset it represents. To achieve this, the value of any one stablecoin is pegged to a commodity or financial instrument, such as the US Dollar (USD), with its supply regulated by an algorithm or demand. The main goal of stablecoins is to provide an on/off-ramp for investors willing to trade and invest in cryptocurrencies. Stablecoins also allow investors to store value since cryptocurrencies, in general, are subject to volatility.
Bitcoin dominance is the ratio of Bitcoin's market capitalization to the total market capitalization of all cryptocurrencies combined. It provides a clear picture of Bitcoin’s interest among investors. A high BTC dominance typically happens before and during a bull run, in which investors resort to investing in relatively stable and high market capitalization cryptocurrency like Bitcoin. A drop in BTC dominance usually means that investors are moving their capital and/or profits to altcoins in a quest for higher returns, which usually triggers an explosion of altcoin rallies.
Author

John Isige
FXStreet
John Isige is a seasoned cryptocurrency journalist and markets analyst committed to delivering high-quality, actionable insights tailored to traders, investors, and crypto enthusiasts. He enjoys deep dives into emerging Web3 tren



