Ripple Price Forecast: XRP accelerates decline below $1.00 amid fading retail participation
- XRP remains pressured below the key $1.00 level, trading around $0.95 on Monday.
- XRP derivatives demand fades as retail buyers retreat and futures Open Interest drops to 2.1 billion XRP.
- The XRP technical structure shows persistent weakness despite oversold conditions.


Ripple (XRP) ticks down on Monday, trading at $0.95 as sellers remain largely in control. Bulls' attempts to regain control have increasingly failed in recent weeks, aligning with the broader crypto market.
Derivatives demand slumps as XRP trades near multi-year lows
XRP trades around levels last seen in November 2024, signaling significant and persistent overhead pressure. The derivatives market mirrors the broader sell-off, with perpetual futures Open Interest (OI) down to about 2.06 billion XRP on Monday, from 2.13 billion XRP the day before.
OI tracks the notional value of XRP futures positions that remain open and unsettled in the derivatives market. In other words, how much money is currently participating in XRP price movements via futures and option contracts.
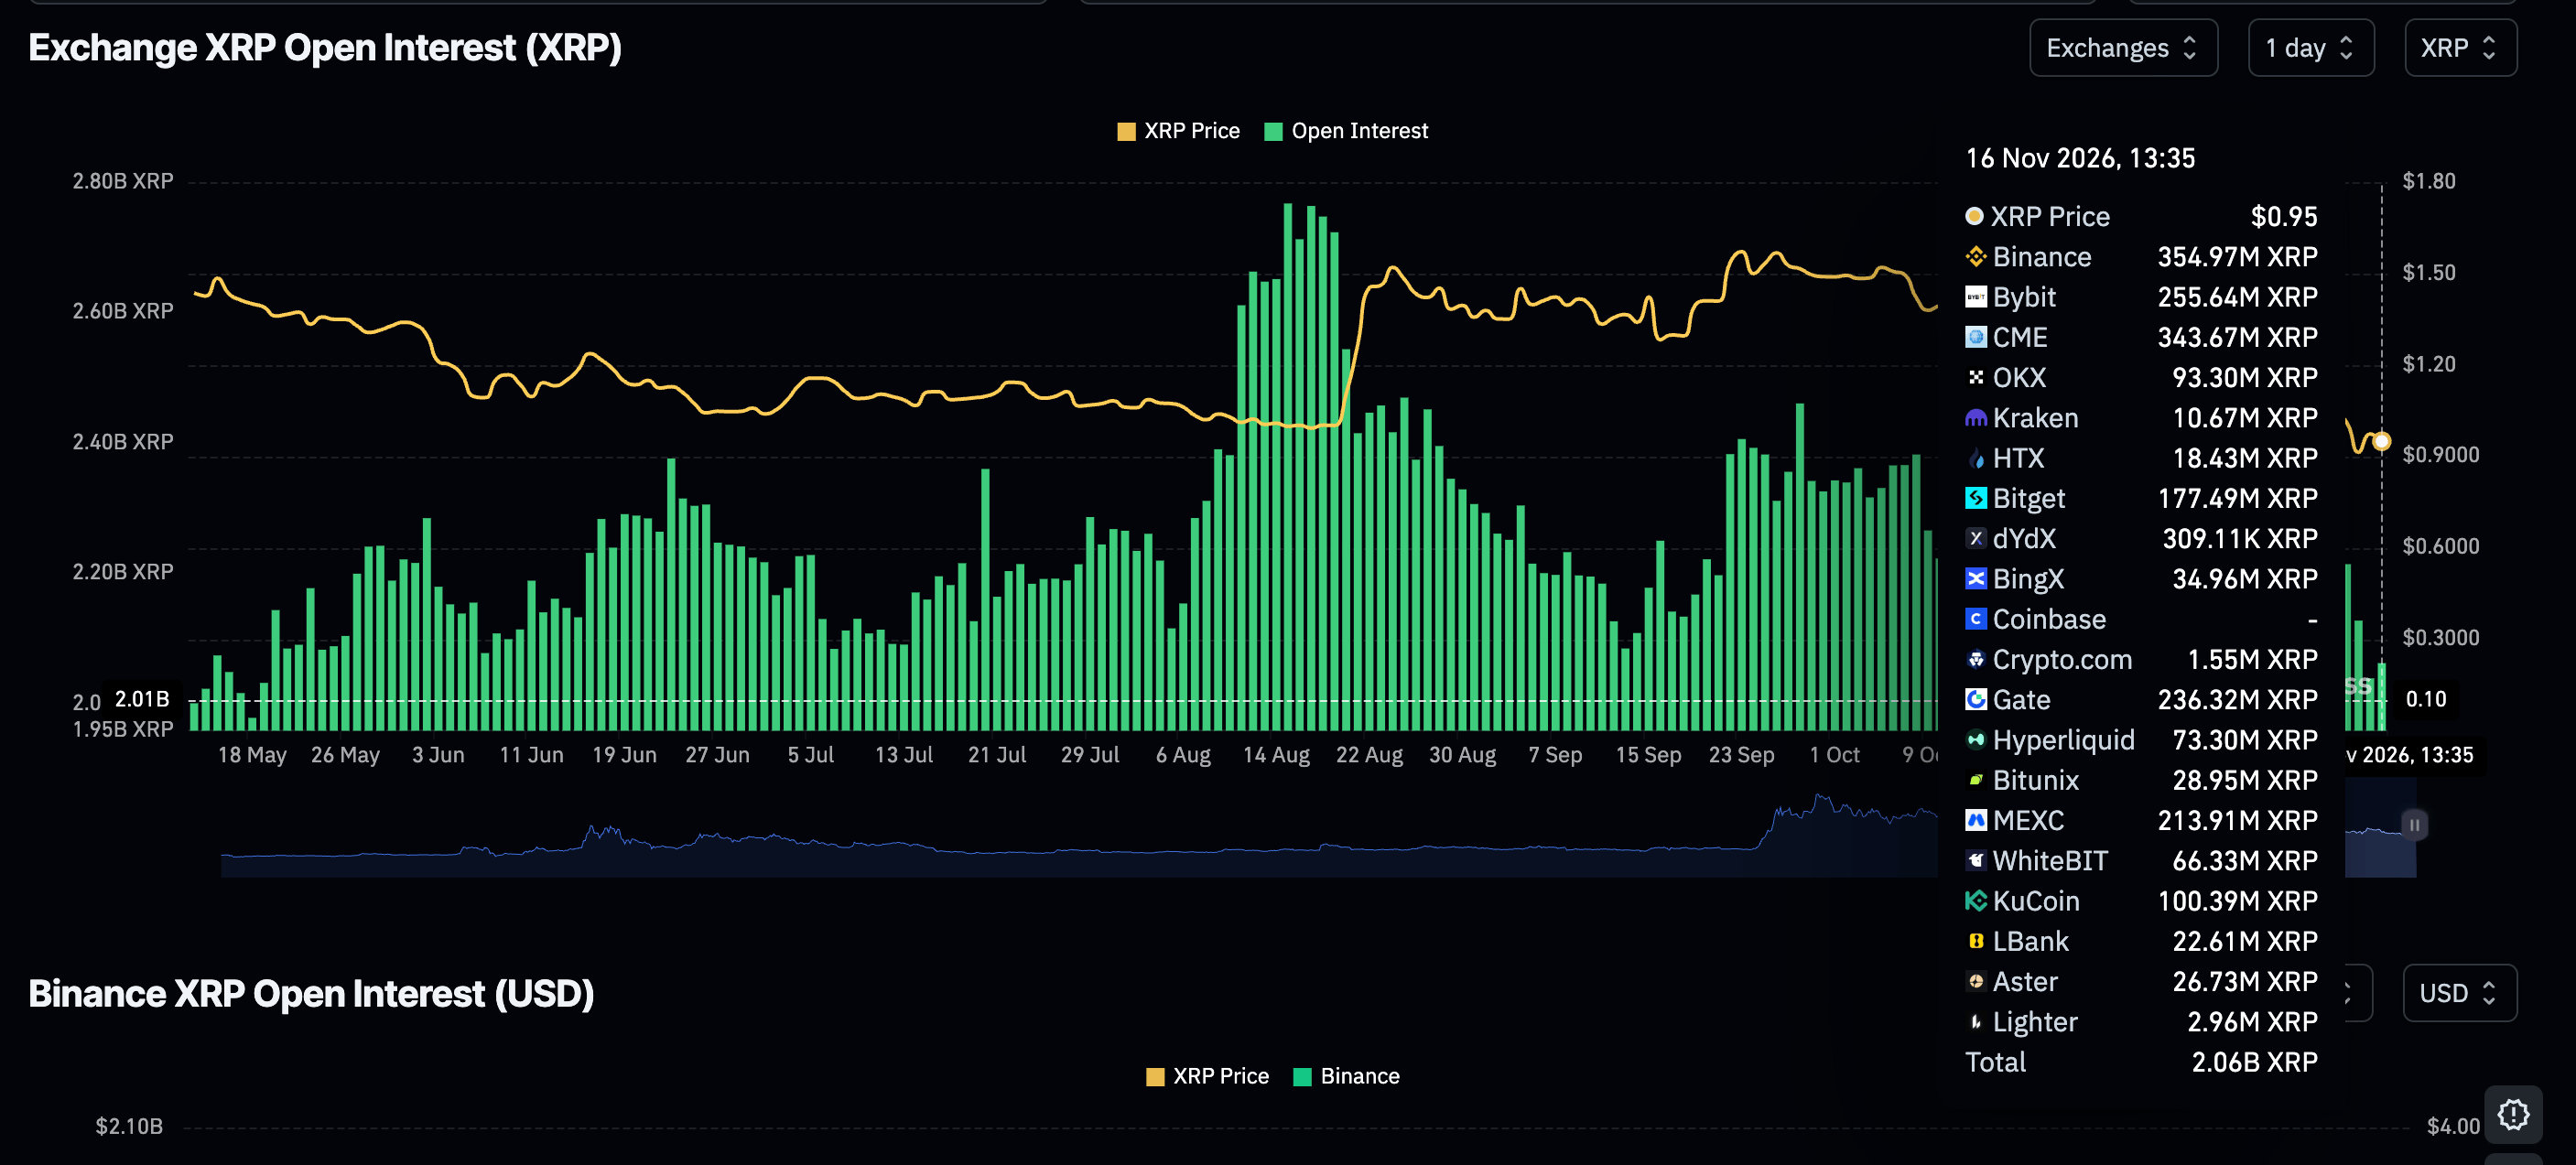
Sustained weakness in the derivatives market implies reduced retail participation, which often negatively impacts price, especially if more traders are betting on short positions and long position liquidations are mounting. CoinGlass data shows long position liquidations at roughly $2.45 million, compared with $1.18 million in short position liquidations.
Technical analysis: XRP sellers stay in control
XRP trades at $0.95, extending a bearish near-term bias as it holds well beneath the 50-day, 100-,day and 200-day Exponential Moving Averages (EMAs) clustered between roughly $1.23 and $1.33.
The SuperTrend line at $1.13 also stays overhead, reinforcing a capped environment despite some stabilization in momentum, with the Relative Strength Index (RSI) lingering in oversold territory near 25 and the Moving Average Convergence Divergence (MACD) histogram slightly less negative, hinting at fading selling pressure rather than a confirmed reversal.
Initial resistance appears at the SuperTrend barrier near $1.13, followed by the 50-day EMA at $1.23 and the descending resistance trendline break point around $1.24.
Above these levels, the 100-day EMA at $1.27 and the 200-day EMA at $1.33 define a broader supply zone that would need to be reclaimed to ease the prevailing bearish tone, while on the downside, the absence of nearby mapped supports leaves the pair vulnerable to further exploration of new lows if selling resumes.
(The technical analysis of this story was written with the help of an AI tool. Know more.)
Open Interest, funding rate FAQs
Higher Open Interest is associated with higher liquidity and new capital inflow to the market. This is considered the equivalent of increase in efficiency and the ongoing trend continues. When Open Interest decreases, it is considered a sign of liquidation in the market, investors are leaving and the overall demand for an asset is on a decline, fueling a bearish sentiment among investors.
Funding fees bridge the difference between spot prices and prices of futures contracts of an asset by increasing liquidation risks faced by traders. A consistently high and positive funding rate implies there is a bullish sentiment among market participants and there is an expectation of a price hike. A consistently negative funding rate for an asset implies a bearish sentiment, indicating that traders expect the cryptocurrency’s price to fall and a bearish trend reversal is likely to occur.
Author
John Isige
FXStreet
John Isige is a seasoned cryptocurrency journalist and markets analyst committed to delivering high-quality, actionable insights tailored to traders, investors, and crypto enthusiasts. He enjoys deep dives into emerging Web3 tren