Ripple Price Forecast: Bears push XRP to key support while ETFs try to cushion the fall
- XRP is down 2% so far on Monday, marking two consecutive days of decline amid rising selling pressure.
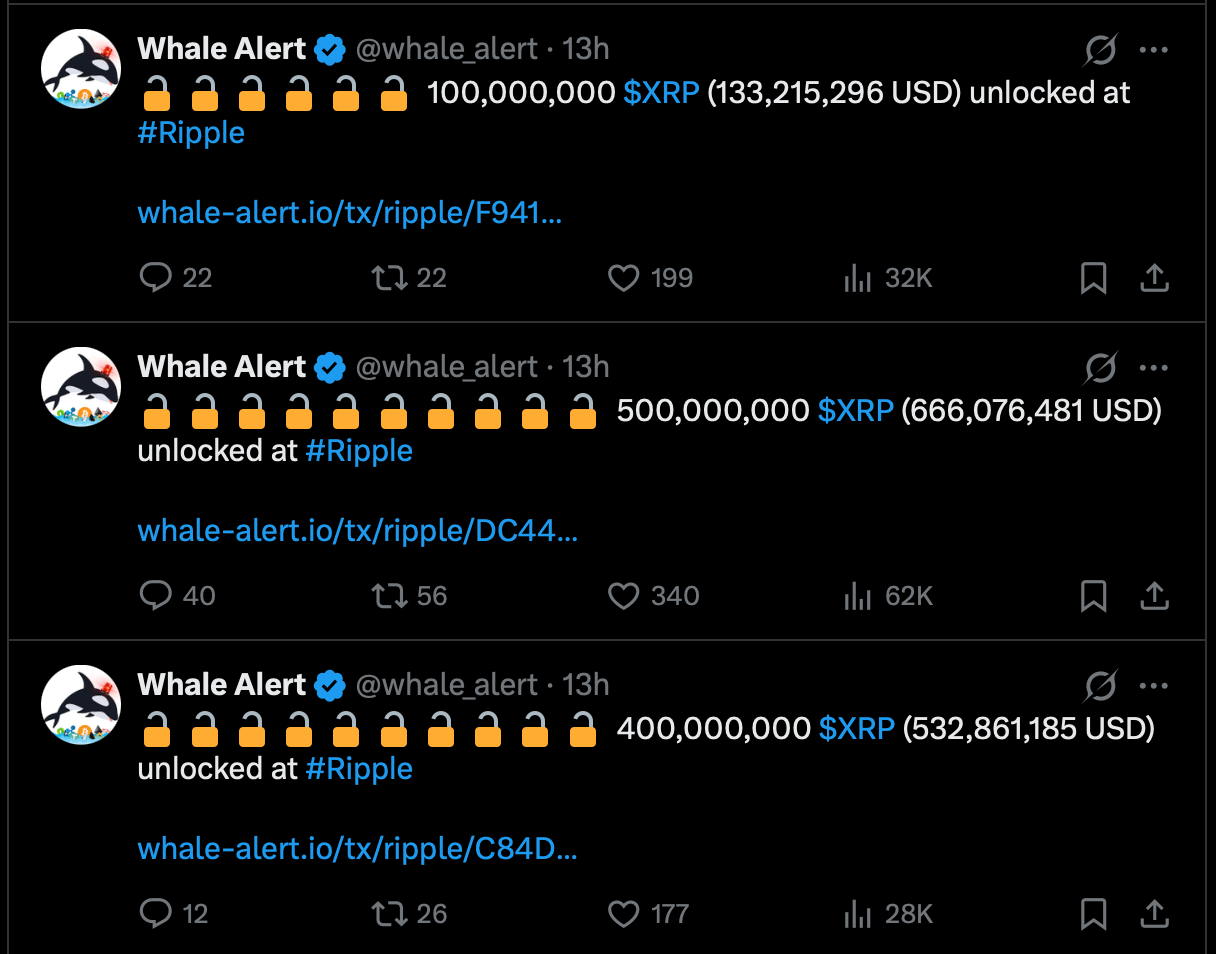
- Data show around 1 billion XRP tokens were unlocked over the last 24 hours.
- Persistent institutional interest, reflected by mild ETF inflows, could cushion XRP’s downside amid declining broader market conditions.

Ripple (XRP) is down 2% at press time on Monday as the broader crypto market loses risk appetite. On-chain data shows 1 billion XRP unlocked over the last 24 hours from Ripple’s escrow wallets, while the mild inflows into XRP-focused Exchange Traded Funds (ETFs) from last week reflect steady institutional interest.
XRP unlocks outweigh institutional inflows
On-chain data shows that Ripple's programmatic monthly XRP release from escrow wallets unlocked 1 billion XRP over the last 24 hours. However, the unlocks are usually re-locked, keeping the rise in circulation supply to minimal. Still, the misinterpretation of the routine liquidity management as selling pressure often leads deteriorates the retail sentiment.
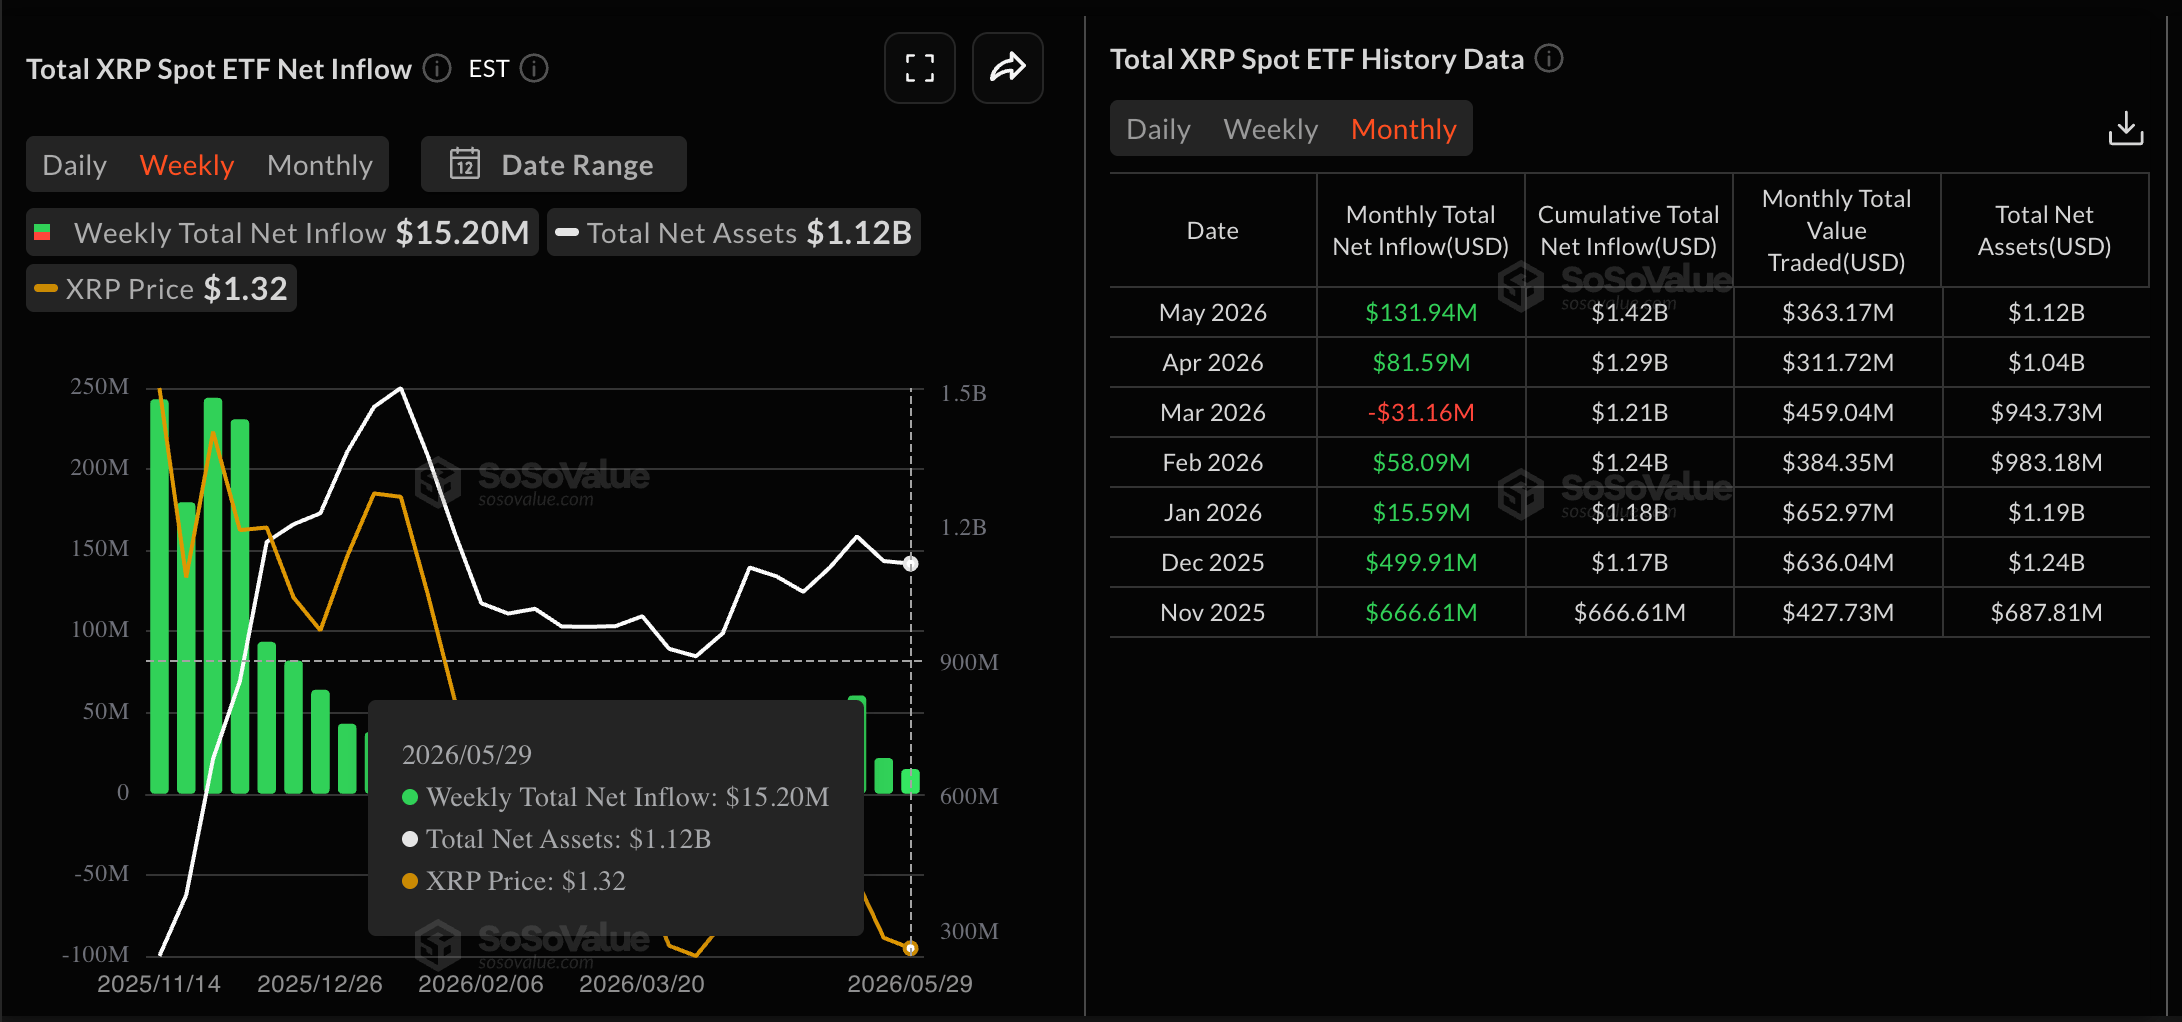
On the institutional side, the XRP ETFs recorded $131.94 million in inflows in May, while Bitcoin and Ethereum ETFs offloaded $2.43 billion and $540.88 million last month. The $15.20 million in inflows last week marks its fourth week of inflows, reflecting the steady institutional demand.
Will XRP price break below the crucial demand zone?
XRP hovers around $1.3000 at press time on Monday, extending its decline beneath all the major Exponential Moving Averages and preserving a bearish near-term bias. The pair holds well under the 50-day EMA at $1.3824 and the 100-day EMA at $1.4519, signaling that recent bounces have been sold into rather than accumulated.
Momentum readings back the downside tone, with the Relative Strength Index (RSI) at 37 on the daily chart shows a downtick toward the oversold boundary, while the Moving Average Convergence Divergence (MACD) and signal line extend their decline in the negative territory, hinting that selling pressure remains dominant.
Looking down, a bearish continuation below $1.3000 could threaten the $1.2700-$1.2543 support zone, which remains intacts since February 28. A decisive close below this zone would set XRP on a steady correction wave toward the February 6 low at $1.1179.
On the topside, initial resistance emerges at the 50-day EMA near 1.38, where any corrective rebound would likely face its first significant supply zone. A sustained break above that barrier would expose the 100-day EMA around 1.45, with the 200-day EMA much higher at 1.65 acting as a broader bearish pivot that caps the larger trend.
(The technical analysis of this story was written with the help of an AI tool.)
Bitcoin, altcoins, stablecoins FAQs
Bitcoin is the largest cryptocurrency by market capitalization, a virtual currency designed to serve as money. This form of payment cannot be controlled by any one person, group, or entity, which eliminates the need for third-party participation during financial transactions.
Altcoins are any cryptocurrency apart from Bitcoin, but some also regard Ethereum as a non-altcoin because it is from these two cryptocurrencies that forking happens. If this is true, then Litecoin is the first altcoin, forked from the Bitcoin protocol and, therefore, an “improved” version of it.
Stablecoins are cryptocurrencies designed to have a stable price, with their value backed by a reserve of the asset it represents. To achieve this, the value of any one stablecoin is pegged to a commodity or financial instrument, such as the US Dollar (USD), with its supply regulated by an algorithm or demand. The main goal of stablecoins is to provide an on/off-ramp for investors willing to trade and invest in cryptocurrencies. Stablecoins also allow investors to store value since cryptocurrencies, in general, are subject to volatility.
Bitcoin dominance is the ratio of Bitcoin's market capitalization to the total market capitalization of all cryptocurrencies combined. It provides a clear picture of Bitcoin’s interest among investors. A high BTC dominance typically happens before and during a bull run, in which investors resort to investing in relatively stable and high market capitalization cryptocurrency like Bitcoin. A drop in BTC dominance usually means that investors are moving their capital and/or profits to altcoins in a quest for higher returns, which usually triggers an explosion of altcoin rallies.
Author

Vishal Dixit
FXStreet
Vishal Dixit holds a B.Sc. in Chemistry from Wilson College but found his true calling in the world of crypto.



