Pi Network Price Predictions: PI extends losses below $0.20 amid second phase of mainnet migration
- Pi Network is down almost 7% on Tuesday, extending losses below $0.20.
- The announcement of the second migration to the mainnet fails to boost retail sentiment.
- The technical outlook for PI is bearish as RSI and MACD indicate increased downside pressure.

Pi Network (PI) edges lower by nearly 7% at press time on Tuesday, testing grounds below its crucial 50-day Exponential Moving Average (EMA) at $0.1900. The announcement of the second migration to the mainnet, enabling users to deposit PI on Centralized Exchanges (CEXs), adds to the downside pressure amid the risk of increased selling. The technical outlook for PI is bearish, as a close below the 50-day EMA could risk erasing the recent gains.
PI at risk amid migration news, waning retail sentiment
Pi Network announced in an X post on Monday that the second migration for testnet users has begun, allowing users to transfer their testnet wallet PI tokens to the mainnet. This aims to boost user participation on the mainnet and also allows long-term holders to take profits by depositing their PI with CEXs.
In the case of Pi Network, the mainnet migrations are a steady drag on the PI token, as the community remains skeptical about the project due to delayed responses and a lack of clarity on Know Your Customer (KYC) rules.

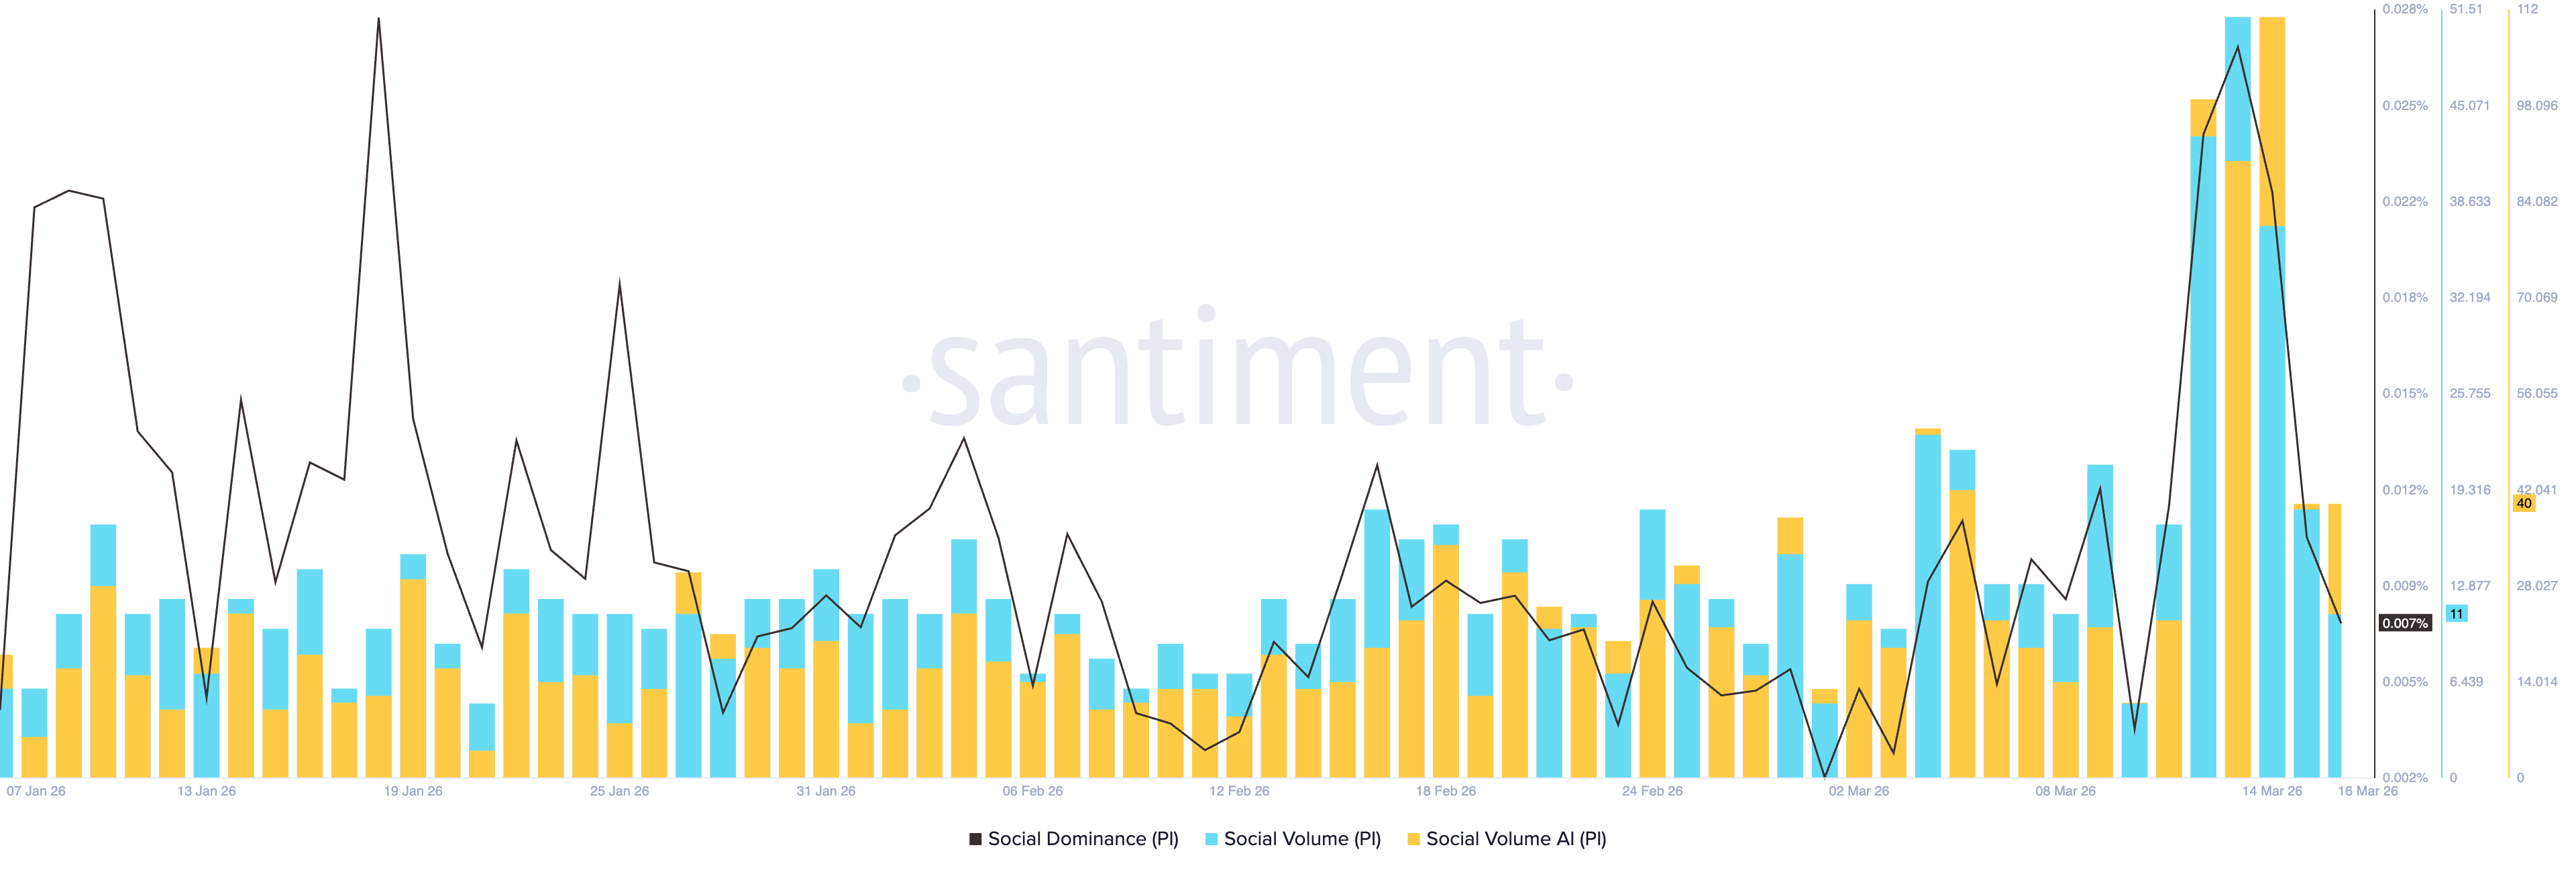
Santiment data shows the PI token is losing retail interest, in line with the ongoing downtrend. The Social volume and dominance of PI were down to 11 posts and 0.007%, respectively, on Monday, from 18 posts and 0.010% on Sunday. A steady decline in PI retail interest could deepen the downside as it remains a highly speculative token.
Will Pi Network extend losses to $0.15?
Pi Network is approaching the $0.1800 mark at press time on Tuesday, extending intraday losses to roughly 7%. The near-term bias turns bearish after the rejection from the late-January peak near the 200-day EMA at $0.2799.
PI now trades below the 50-day EMA, while the descending 100-day and 200-day EMAs signal a broader bearish structure.
The Moving Average Convergence Divergence (MACD) blue line has slipped below its red signal line, triggering a sell signal, while negative histograms are expanding below the zero line. Meanwhile, the Relative Strength Index (RSI) at 46 retreats below the midline from the overbought zone, reinforcing fading bullish pressure.
A daily close below the 50-day EMA at $0.1900 could confirm further losses for PI, potentially targeting the February 23 low at $0.1556.
If PI manages a daily close above $0.1900, it would indicate easing downside pressure, possibly leading to a sideways trend below the 100-day EMA at $0.1999.
(The technical analysis of this story was written with the help of an AI tool.)
Author

Vishal Dixit
FXStreet
Vishal Dixit holds a B.Sc. in Chemistry from Wilson College but found his true calling in the world of crypto.



