Hyperliquid Price Forecast: Downside risk looms as momentum stretches thin
- Hyperliquid edges lower on the day, easing after stretching its extended rally above $89 the previous day.
- Institutional demand for HYPE remains firm, with over $12 million in inflows last week.
- Hyperliquid rally could be losing steam as momentum indicators point to an overextended bullish phase.

Hyperliquid (HYPE) price is trading in the red on Monday, stalling after 10% gains last week. HYPE-focused Exchange Traded Funds (ETFs) recorded their fifth consecutive weekly inflows, projecting steady institutional demand. The technical outlook for HYPE warns of potential downside risk as bullish momentum stretches thin.
UBS, Bank of Montreal, Jane Street, and other large funds hold HYPE
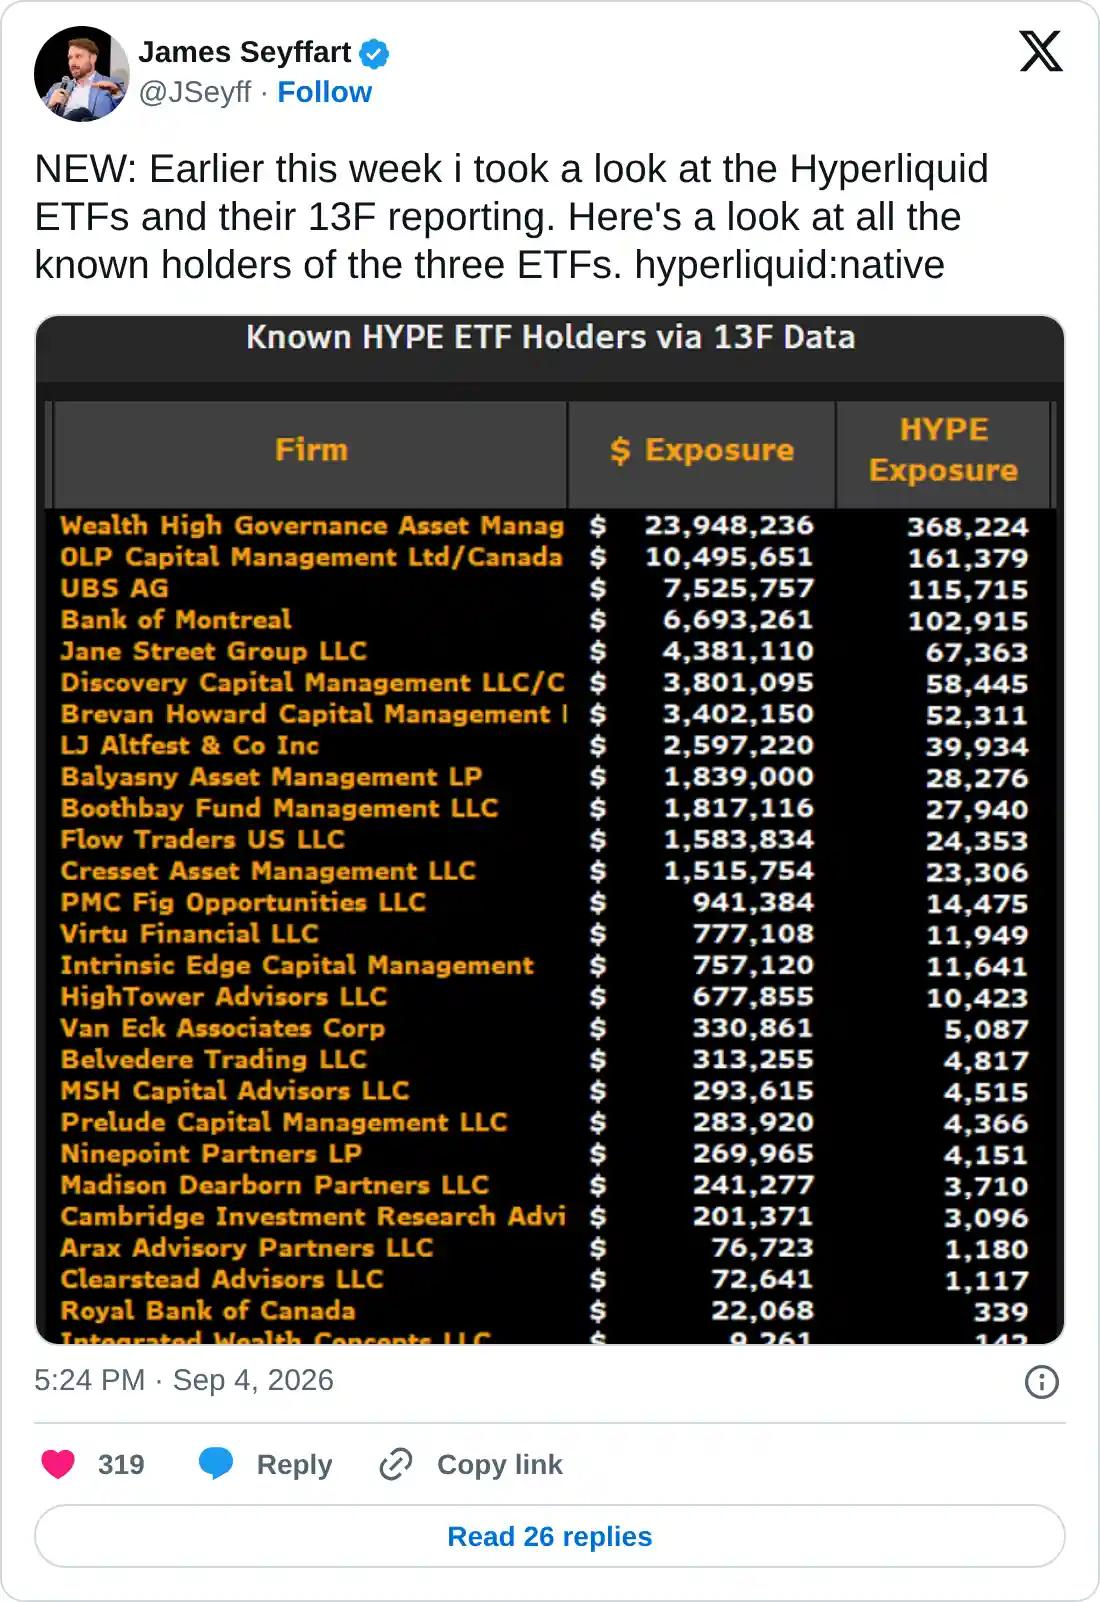
James Seyffart, a Bloomberg ETF analyst, shared in an X post on Friday that leading financial institutions hold HYPE, such as Wealth High Governance, OLP Capital, UBS, Bank of Montreal, Jane Street, among others. Exposure to the Decentralized Exchange’s (DEX) native token reflects strong demand from large institutional investors as US President Donald Trump plans to bring Hyperliquid onshore.
SoSoValue data shows that HYPE ETFs recorded $12.27 million in inflows last week, down from $56.86 million in the previous week. Still, the ETF inflows remain positive for the fifth consecutive week, reaffirming strong institutional demand.
Technical outlook: Could HYPE hit $100 before the rally fades?
Hyperliquid holds above $86 at press time on Monday, maintaining a clear bullish bias after advancing 10% last week. The DEX token remains well above the 50-day Exponential Moving Average (EMA) at $71.55, while the 100-day EMA at $65.05 trails far below spot, reinforcing an established uptrend, and the 200-day EMA near $56.64 underpins the broader bullish structure.
Fibonacci retracements from the latest swing from $76.93 to $51.20 sit comfortably beneath current prices, suggesting a deep cushion on pullbacks. HYPE struggles to advance above the 127.2% Fibonacci extension level at $85.94, indicating strong headwinds as investors shift toward profit-taking.
Momentum-wise, the Relative Strength Index (RSI) around 64 on the daily chart stays in bullish territory, easing from the overbought zone. At the same time, the Moving Average Convergence Divergence (MACD) slips marginally below its signal line, reaffirming a brief loss of upside momentum.
From a technical perspective, HYPE forms a near-term upward-sloping channel pattern, with the lower boundary near $82.40. A confirmed breakout above this level could extend its correction toward the $76.93 Fibonacci anchor. Deeper pullbacks could test the 50-day EMA at $71.55, reinforced by the 78.6% Fibonacci retracement at $70.51.
Looking up, a decisive close above the upward-sloping trendline near $89.61 could open the path toward the 161.8% extension level at $98.95, followed by the $100 psychological threshold.
(The technical analysis of this story was written with the help of an AI tool. Know more.)
Author

Vishal Dixit
FXStreet
Vishal Dixit holds a B.Sc. in Chemistry from Wilson College but found his true calling in the world of crypto.




