Pi Network Price Forecast: Demand remains muted despite mainnet upgrade, weighing on price
- Pi Network extends losses on Tuesday, although it still holds above a descending support trendline.
- Pi Core Team announced the mainnet upgrade to the Stellar protocol version 21.
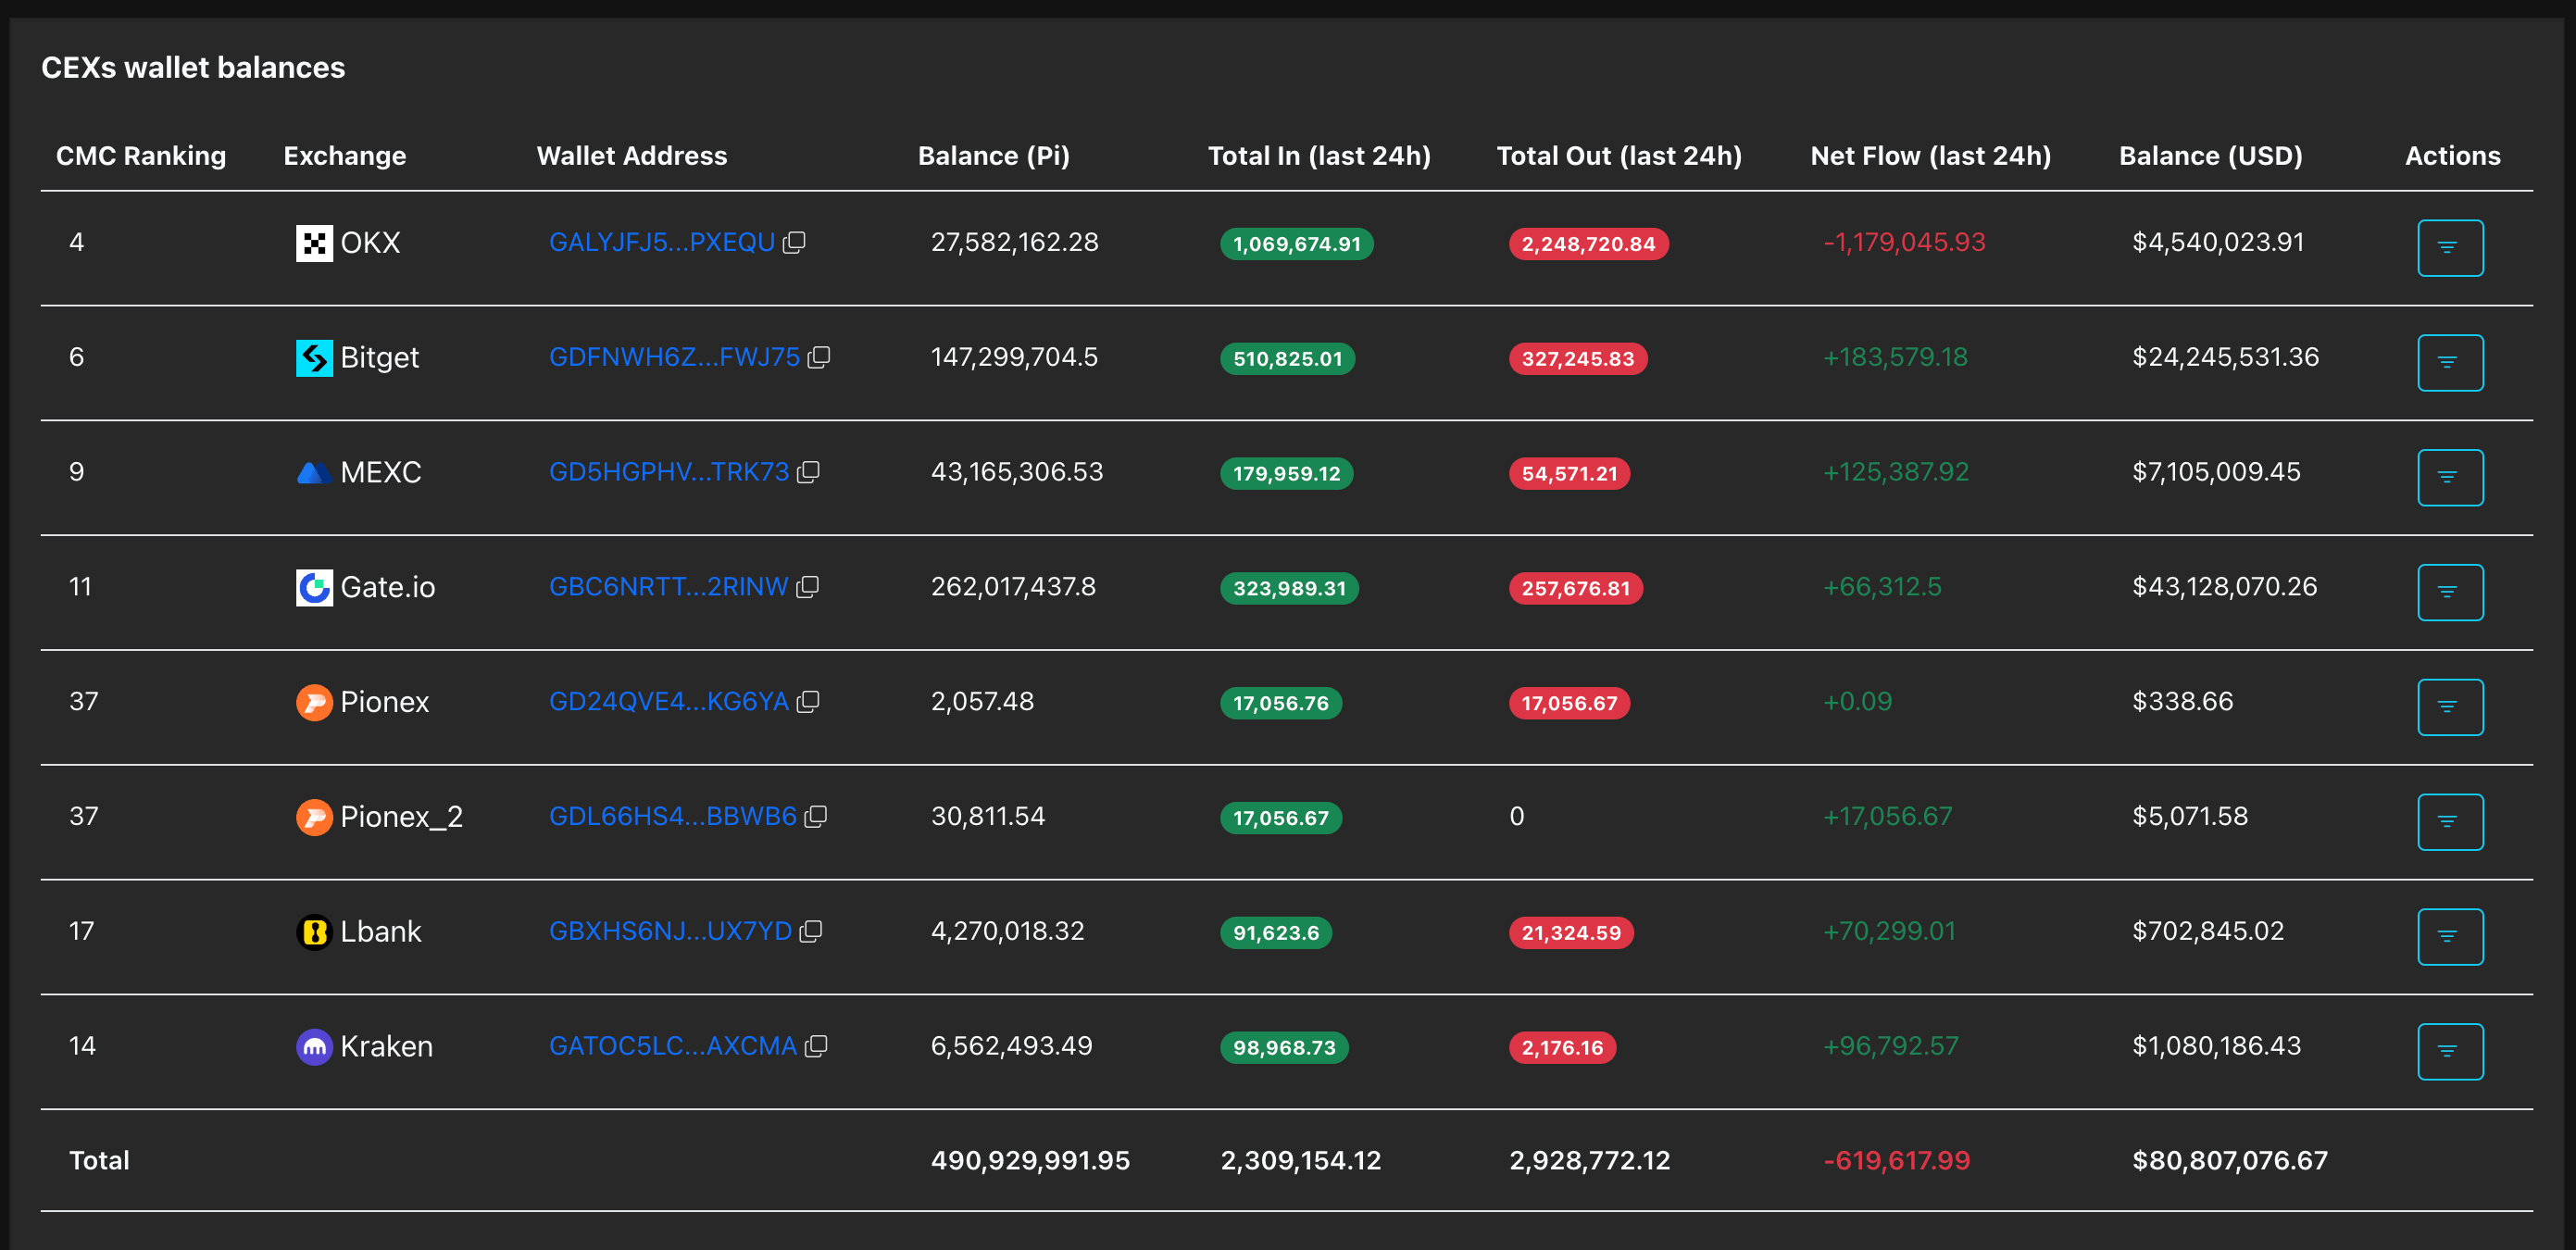
- PiScan data shows a net outflow of over 600,000 PI tokens from exchanges in the past 24 hours, signaling reduced downside pressure.

Pi Network (PI) extends losses in its downside-leaning consolidation phase at press time on Tuesday, suggesting a persistent bearish pressure on the token. The Pi Core Team has announced the mainnet upgrade to the Stellar Protocol version 21, a step towards the planned version 22, although price has failed to react positively to the news. While on-chain data signals that downside pressure may be waning, the technical outlook remains bearish as the gradual but continued downtrend threats a key support trendline.
Selling pressure eases amid Pi mainnet upgrade
The Pi Core Team announced the successful mainnet upgrade to Stellar protocol version 21, the underlying blockchain. The team also said that version 22, which is under development, will enable smart contract functionality on Pi Network and potentially expand its use cases.

The selling pressure on Centralized Exchanges (CEXs) has eased amid the announcement of the mainnet upgrade and the broader market recovery. PiScan data shows CEXs recorded an outflow of 619,617 PI tokens over the last 24 hours, after an inflow of 1.92 million PI tokens on Monday. While this hasn't significantly impacted prices, consistent outflows could reduce the available supplyand ease easing the downside pressure.
Technical outlook: Will Pi Network hold its ground?
Pi Network maintains a muted downside-tapering trend below the main 50-day Exponential Moving Average (EMA) at $0.1794, keeping a clear bearish near-term bias. The immediate support for PI lies at the descending trendline, which connects the March 18 and April 2 lows, near Monday's low at $0.1633. A decisive close below this level could boost the near-term decline toward the February 23 low at $0.1556.
Momentum indicators reinforce the broader bearish tone, as the Relative Strength Index (RSI) on the daily chart is at 39 and descending toward the oversold zone. Meanwhile, the Moving Average Convergence Divergence (MACD) histogram bars are contracting as average lines converge, suggesting the trend remains marginally bearish.
On the topside, initial resistance aligns with the 50-day EMA at $0.1794, which guards a stronger barrier at the 100-day EMA around $0.1893.
(The technical analysis of this story was written with the help of an AI tool.)
Author

Vishal Dixit
FXStreet
Vishal Dixit holds a B.Sc. in Chemistry from Wilson College but found his true calling in the world of crypto.



