Ocean Price Prediction: Here comes the pain?
- Ocean price has declined by 10% this week.
- The bears may push Ocean toward the $0.26 liquidity zone.
- Invalidation of the bearish thesis occurs above the previous week's swing high at $0.56.
Ocean price is at risk of a 35% decline if the current level fails to hold as support. Traders should keep a close eye for any confirmation signals before entering a short position in anticipation of the downtrend.
Ocean Price shows uncertainty
Ocean price has been in a steep decline as investors have been taking profits after a 200% relief rally earlier in the winter. Currently, the price is down 10% and resting at the $0.40 zone. Further downtrend price action is expected if the current price level does not hold as Support.
Ocean price is Currently at $0.40, testing Support from 21-Day Moving Average. On January 10th, 100 million transactions occurred during a sell-off from $0.47 to $0.44c. Since the supportive barrier near the $0.44 zone was breached, the volume of transactions has been sparse, indicating uncertainty in the market as buyers are unsure if the current price can be sustained.
Ocean price has rallied 2.5X to its year-to-date high of 58 cents since January 1st. A Fibonacci retracement of the entire move shows a golden pocket at 61.8% FIB level, 35% below at 26 cents. If the 21-day moving average does not hold as Support, the level will likely be tested in the coming weeks. For traders looking to join the trend, a daily close below the 21-day moving average marked at $0.400 will signal an entry point.
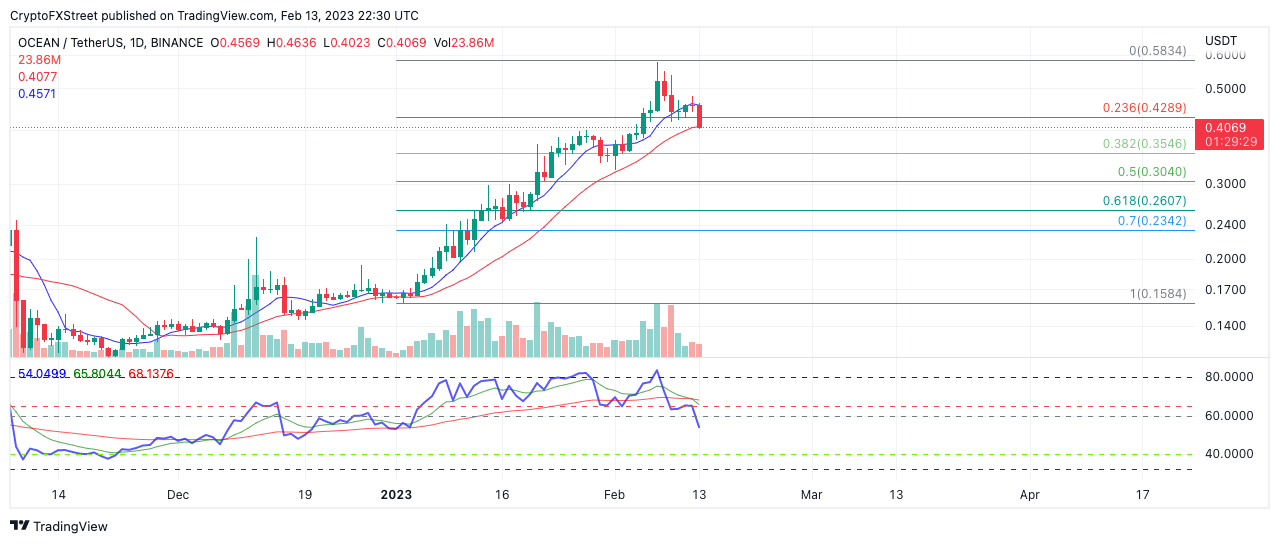
Invalidation of the downtrend thesis will occur if the bulls can push Ocean's price above the monthly swing high of $0.58. This would put the uptrend rally that started in the winter back on pace to reach the $0.75 liquidity zone, resulting in an 85% increase from Ocean's current price.
Author

Tony M.
FXStreet Contributor
Tony Montpeirous began investing in cryptocurrencies in 2017. His trading style incorporates Elliot Wave, Auction Market Theory, Fibonacci and price action as the cornerstone of his technical analysis.


