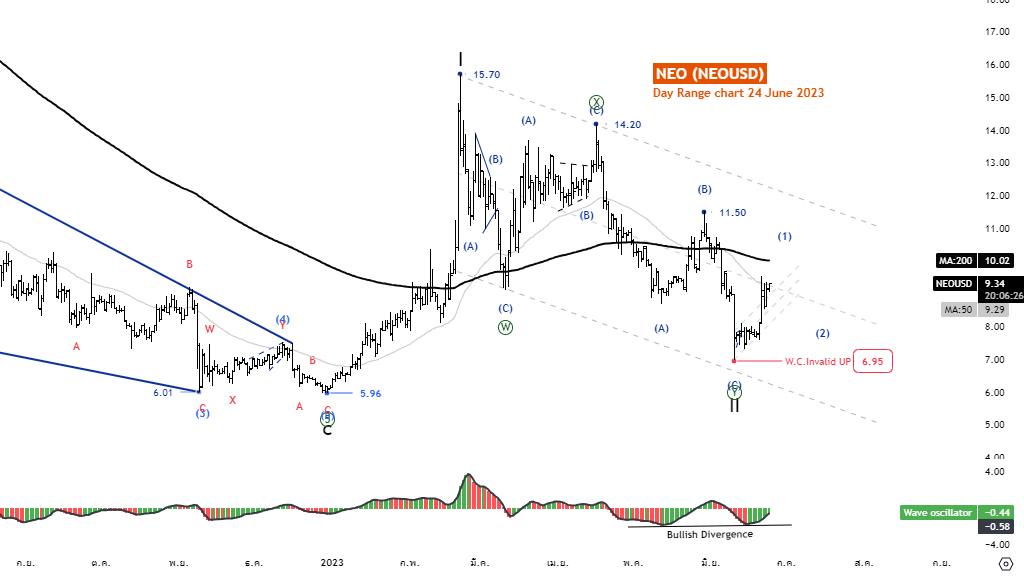
NEO/USD wave II may have ended at the level of 6.97

NEOUSD Elliott Wave Analysis TradingLounge Daily Chart, 24 June 2023.
NEO/U.S.dollar (NEOUSD).
NEOUSD Elliott Wave Technical Analysis.
Function: Reactionary(Counter Trend).
Mode: Corrective.
Structure: Double Corrective.
Position: Wave ((Y)).
Direction Next higher Degrees: Wave II of Motive.
Details: Wave II may have ended at the level of 6.97. Five waves of rise will support this idea.
Wave Cancel invalid Level: 5.91.
NEO/U.S.dollar(NEOUSD)Trading Strategy: NEO tends to end Wave((2)) at the level of 6.95, which is enough to retrace Wave((2)) but still below the MA200 line making us want to. five-wave movement to support this concept And it could be the start of a new uptrend.
NEO/U.S.dollar(NEOUSD)Technical Indicators: The price is below the MA200 indicating a Downtrend, Wave Oscillator has a Bearish momentum
TradingLounge Analyst: Kittiampon Somboonsod, CEWA
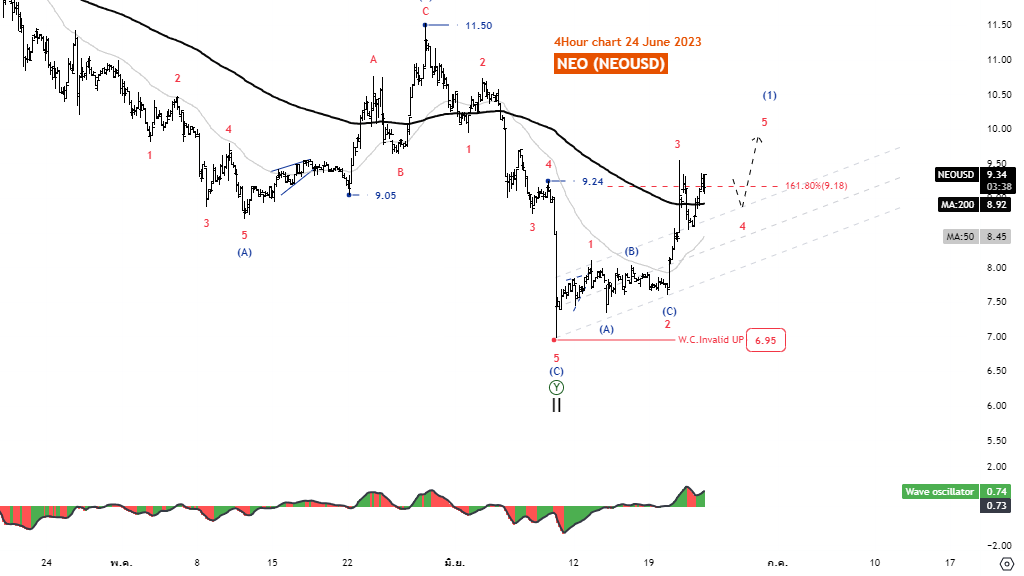
Elliott Wave Analysis TradingLounge 4H Chart, 24 June 2023.
NEO/U.S.dollar(NEOUSD).
NEOUSD Elliott Wave Technical Analysis.
Function: Reactionary(Counter Trend).
Mode: Follow Trend.
Structure: Motive.
Position: Wave 4.
Direction Next higher Degrees: Wave (1) of Motive.
Details: Retracement of wave ((4)) usually .382 x Length wave ((3)).
Wave Cancel invalid Level: 6.95.
NEO/U.S.dollar(NEOUSD)Trading Strategy: NEO is likely to end Wave((2)) at the level of 6.95, which is enough to reverse Wave((2)), also able to break through the MA200 line, a good signal of recovery and a five-wave movement to support this idea. And it could be the start of a new uptrend.
NEO/U.S.dollar(NEOUSD)Technical Indicators: The price is above the MA200 indicating an Uptrend, Wave Oscillator has a Bullish momentum.
Author

Peter Mathers
TradingLounge
Peter Mathers started actively trading in 1982. He began his career at Hoei and Shoin, a Japanese futures trading company.



