NEO Elliott Wave technical analysis [Video]
![NEO Elliott Wave technical analysis [Video]](https://editorial.fxstreet.com/images/Markets/Currencies/Cryptocurrencies/cryptocurrenciesusd.jpg)
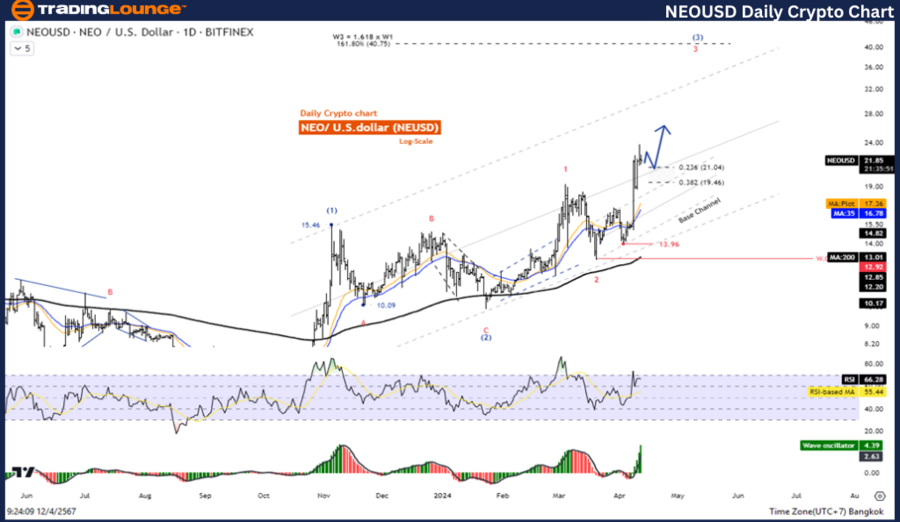
Elliott Wave Analysis TradingLounge Daily Chart,
NEO/U.S. dollar(NEOUSD).
NEO/USD Elliott Wave Technical Analysis
Function: Follow Trend.
Mode: Motive.
Structure: Impulse.
Position: Wave (3).
Direction next higher degrees: Wave ((3)) of Impulse.
Wave cancel invalid level: 9.85.
Details: Wave (3) is Equal to 161.8% of Wave (1) at 24.52.
NEO/U.S. dollar(NEOUSD)Trading Strategy:
NEO is still in an uptrend in the form of an Impulse Wave and the price has a chance to test the 19.45 level before correcting again. Therefore, the overall picture is still a continuous increase. Look for opportunities to open long positions.
NEO/U.S. dollar(NEOUSD)Technical Indicators: The price is above the MA200 indicating an Uptrend, The Wave Oscillator is a Bullish Momentum.
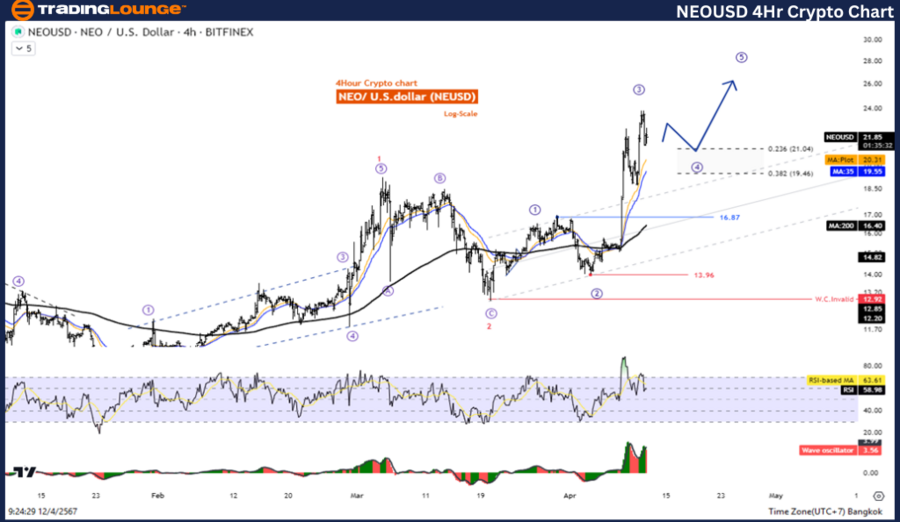
Elliott Wave Analysis TradingLounge 4H Chart,
NEO/U.S. dollar(NEOUSD)
NEO/USD Elliott Wave technical analysis
Function: Follow Trend
Mode: Motive
Structure: Impulse
Position: Wave (3)
Direction next higher degrees: Wave ((3)) of Impulse
Wave cancel invalid level: 9.85
Details: Wave (3) is Equal to 161.8% of Wave (1) at 24.52
NEO/U.S. dollar(NEOUSD)Trading Strategy:
NEO is still in an uptrend in the form of an Impulse Wave and the price has a chance to test the 19.45 level before correcting again. Therefore, the overall picture is still a continuous increase. Look for opportunities to open long positions.
NEO/U.S. dollar(NEOUSD)Technical Indicators: The price is above the MA200 indicating an Uptrend, The Wave Oscillator is a Bullish Momentum.
Technical analyst: Kittiampon Somboonsod
NEO/USD Elliott Wave technical analysis [Video]
Author

Peter Mathers
TradingLounge
Peter Mathers started actively trading in 1982. He began his career at Hoei and Shoin, a Japanese futures trading company.




