Monero Price Forecast: XMR bulls eye $400 breakout amid intense headwinds
- Monero hovers around $375 on Friday, after over 3% rebound from the 200-day EMA on the previous day.
- Retail demand for XMR derivatives remains steady, with anticipation of further upside in the spot price.
- The technical outlook for XMR is cautiously optimistic, with bulls targeting a key resistance trendline near $400.

Monero (XMR) trades around $375 at press time on Friday, displaying mild retracement after over 3% gains the previous day. The privacy coin steadily recovers demand in the derivatives market as traders anticipate further upside amid a broader market risk-on phase. Technically, Monero should clear a key resistance trendline near $400 to signal a steady recovery.
Monero derivatives flash retail confidence
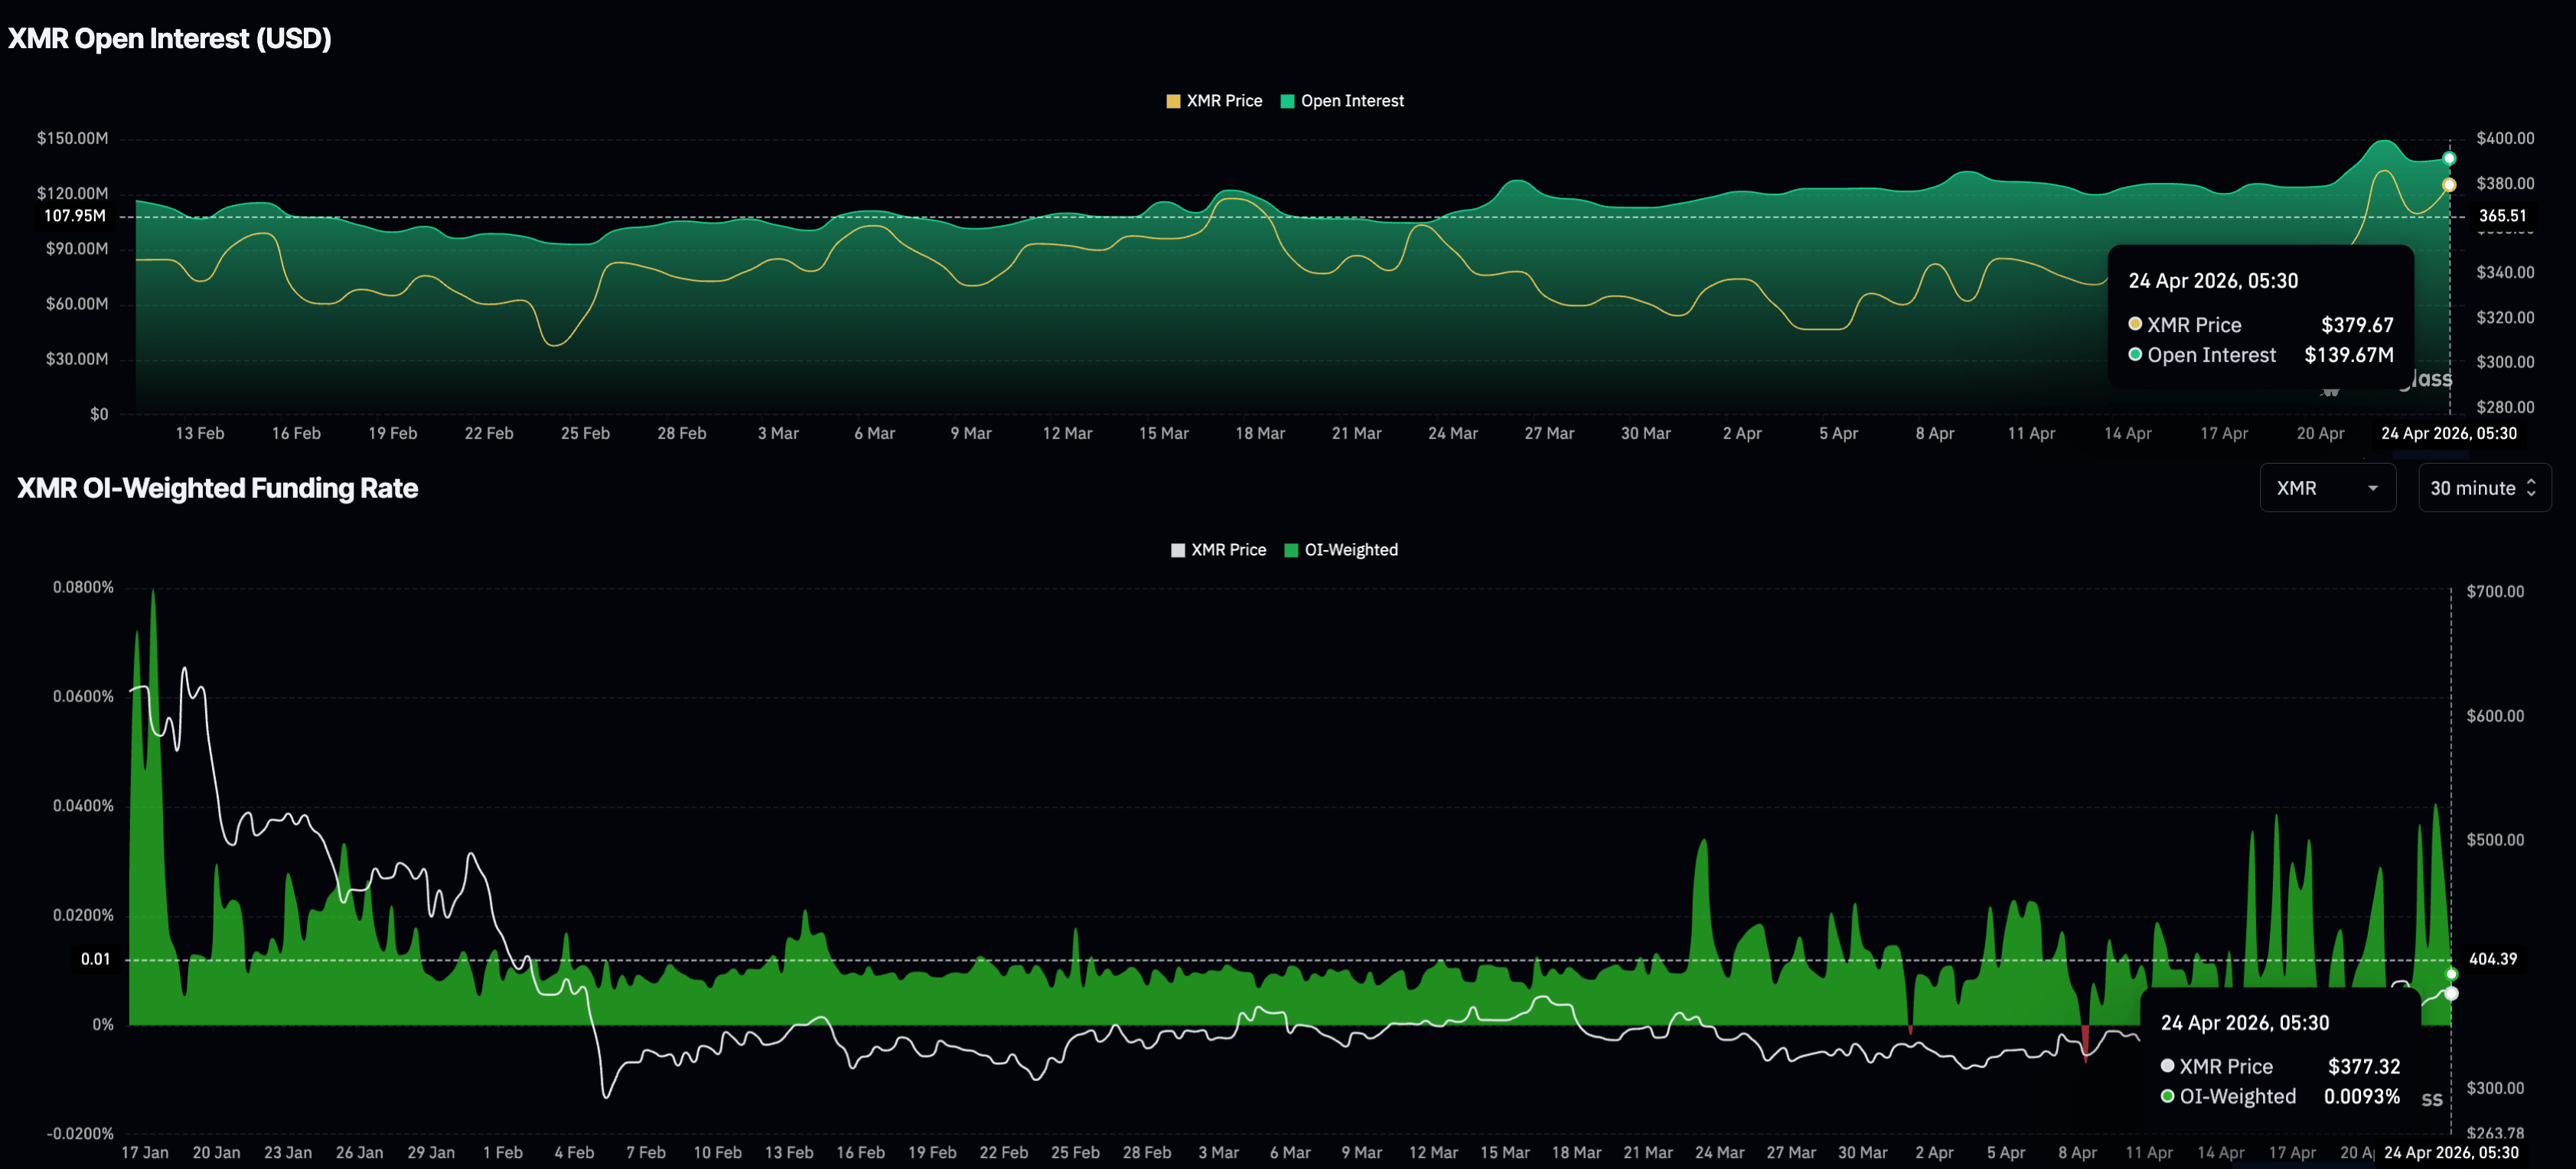
Monero extends a broadly recovering trend since the early February sell-off, driving steady retail demand for its derivatives. CoinGlass data shows the XMR futures Open Interest (OI) at $139.67 million, up from $109.94 million on February 7, reaffirming the renewed risk-on sentiment among investors.
On the other hand, the OI-weighted funding rate at 0.0093% has remained positive for the most part of April so far, indicating a persistent inclination among traders to hold long positions at a premium.
Technical outlook: Will Monero exceed $400?
Monero maintains a bullish near-term bias as it holds above both the 50-day Exponential Moving Average (EMA) at $351 and the 200-day EMA at $364. XMR price action reflects a rising channel pattern on the daily chart, reinforcing the underlying constructive structure.
Meanwhile, the Relative Strength Index (RSI) at 61 and a firmly positive Moving Average Convergence Divergence (MACD) above its signal line suggest sustained upside momentum rather than an immediate exhaustion phase.
On the topside, initial resistance is aligned with the overhead trendline connecting the February 14 and March 16 highs near $400, with further bullish extension exposing the 50% retracement at $470.
On the downside, immediate support emerges at the 200-day EMA at $364, followed by the 50-day EMA at $351. A deeper pullback below the rising support trendline at $330 would be needed to materially dent the current constructive outlook.
(The technical analysis of this story was written with the help of an AI tool.)
Author

Vishal Dixit
FXStreet
Vishal Dixit holds a B.Sc. in Chemistry from Wilson College but found his true calling in the world of crypto.




