Litecoin Price Analysis: LTC/USD struggles to overcome resistance at the SMA 20 and SMA 50
- MACD indicates decreasing bullish momentum.
- The Elliott Oscillator has had four red sessions out of the last five.

LTC/USD daily chart
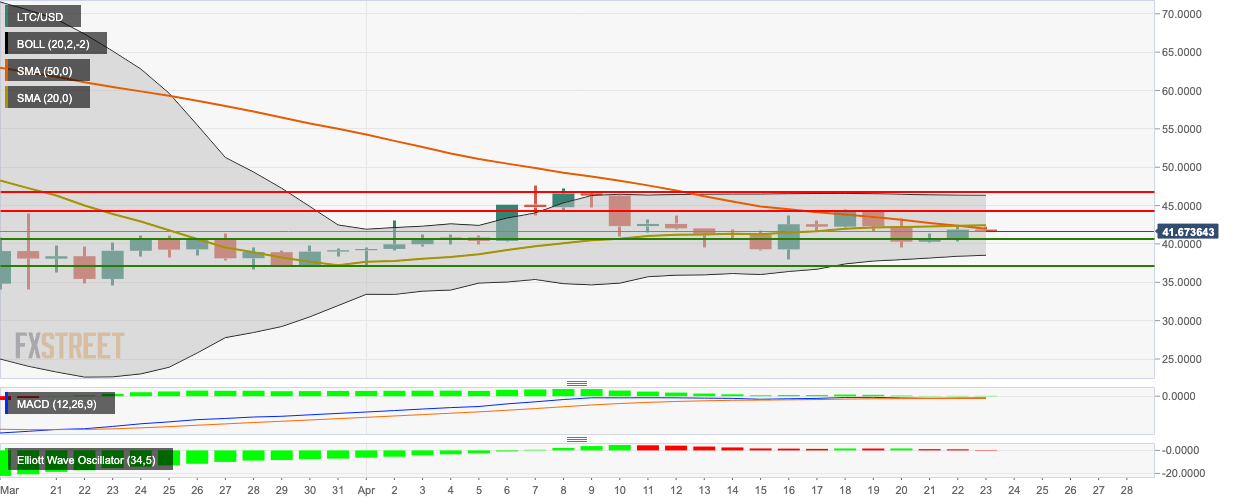
LTC/USD had a bearish start to the day as the price fell from $41.87 to $41.67. The bulls lack the momentum needed to break past resistance at the SMA 20 and SMA 50 curves. The 20-day Bollinger jaw has narrowed, which shows decreasing price volatility. The MACD indicates declining bullish momentum, while the Elliott Oscillator has had four red sessions out of the last five.
Key levels
Author

Rajarshi Mitra
Independent Analyst
Rajarshi entered the blockchain space in 2016. He is a blockchain researcher who has worked for Blockgeeks and has done research work for several ICOs. He gets regularly invited to give talks on the blockchain technology and cryptocurrencies.
More from Rajarshi Mitra


