Hyperliquid Price Forecast: HYPE extends bullish reversal from key support, eyes $50
- Hyperliquid edges above $44 on Wednesday after over 4% gains the previous day.
- Data shows an increase in user activity on Hyperliquid as TVL and stablecoin market capitalization rise.
- Derivatives data show an increase in retail interest amid positional buildup.

Hyperliquid (HYPE) is trading above $44.00 at press time on Wednesday, extending an upward trend for the sixth straight day. The exchange token is gaining retail confidence and user interest as HYPE futures Open Interest and Total Value Locked on Hyperliquid rise. Hyperliquid should clear above $45.52 to sustain a rally above $50.00.
Hyperliquid regains user and retail demand
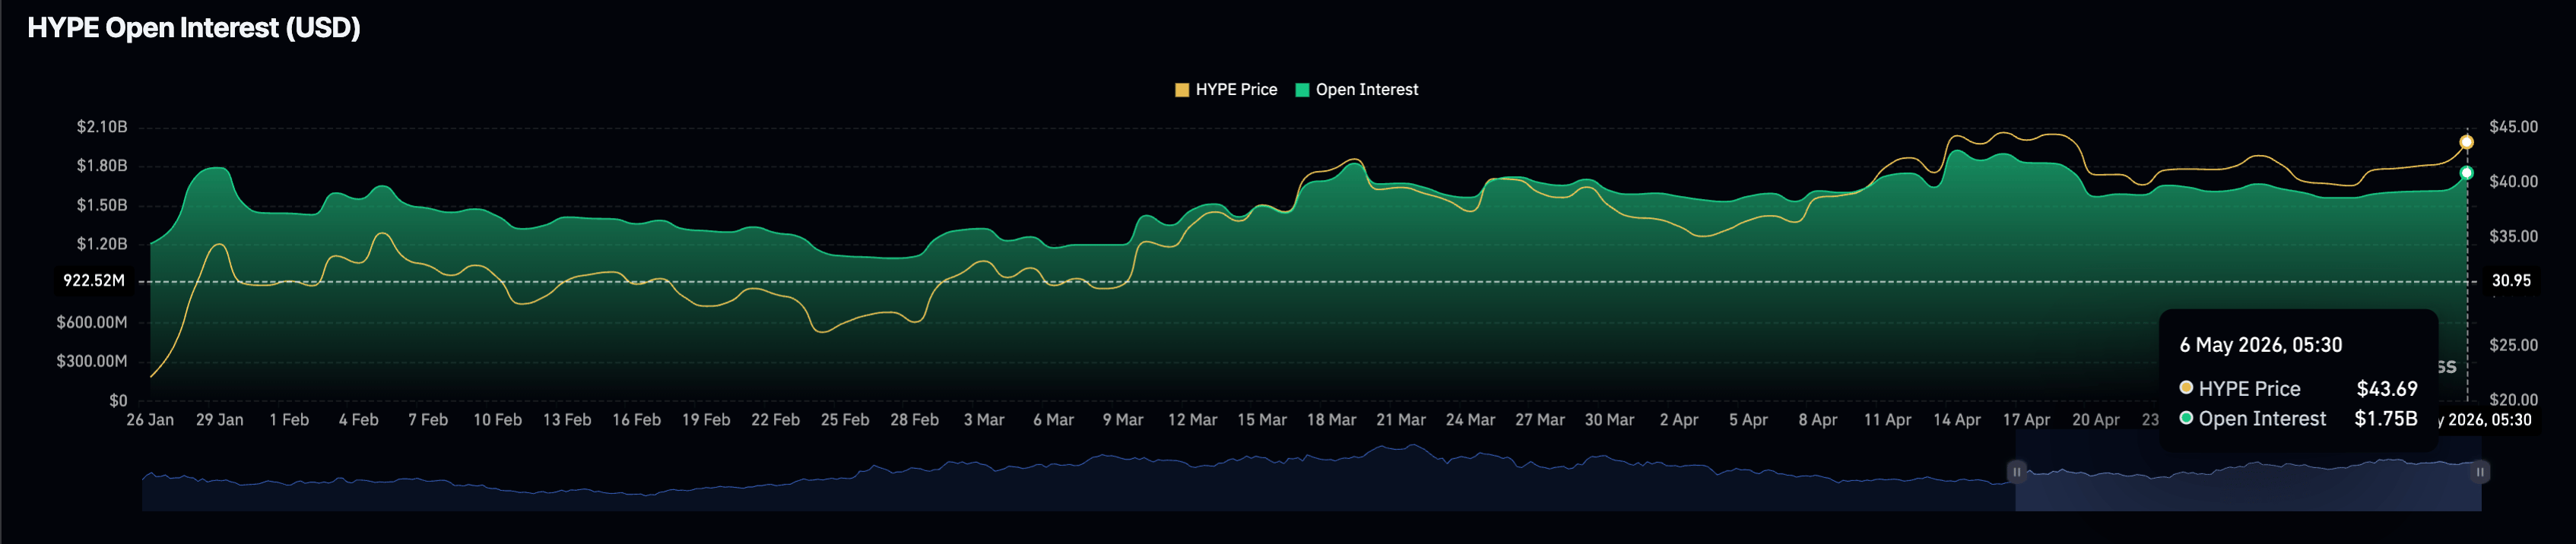
Hyperliquid is gaining strength in the derivatives and DeFi markets as the risk-off sentiment in the broader crypto market wanes. CoinGlass data shows an upsurge in HYPE futures Open Interest (OI) to $1.75 billion, up from $1.62 billion on Tuesday, reflecting increased leverage exposure or a positional buildup.
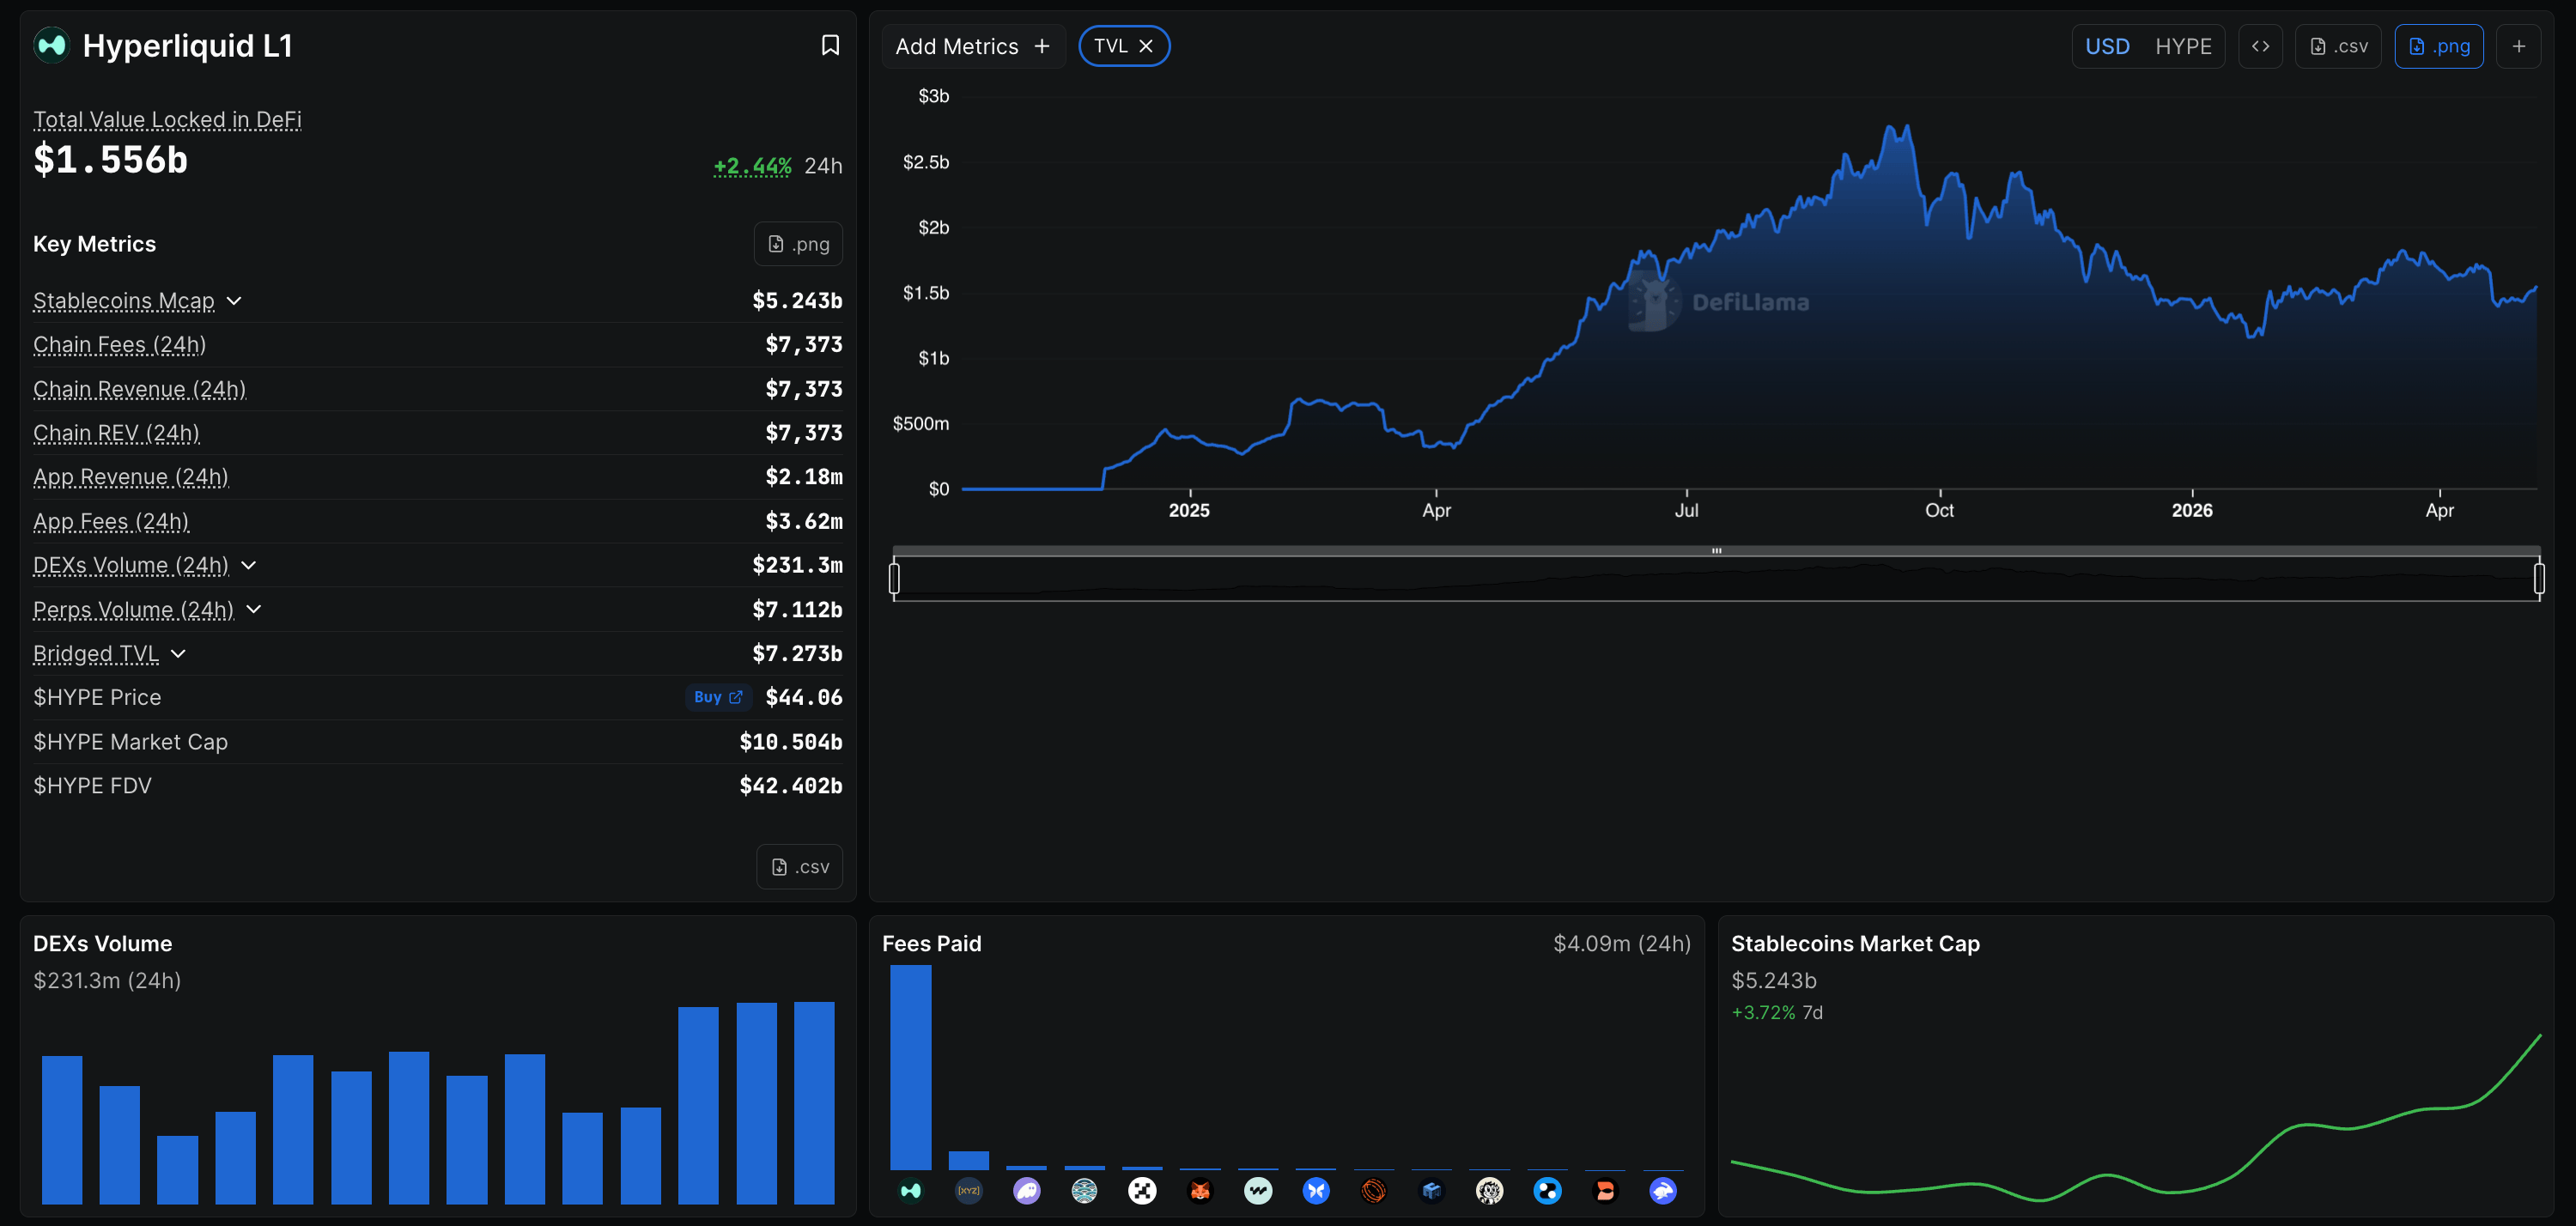
DeFiLlama data shows the Total Value Locked (TVL) on Hyperliquid rose by over 2% over the last 24 hours, to $1.556 billion on Wednesday, suggesting inflows to the platform. Typically, an increase in TVL suggests increased user activity, implying higher revenues. Apart from stablecoins, Hyperliquid ranks as the highest protocol by 7-day revenue at $11.58 million.
Will Hyperliquid price hit $50?
Hyperliquid extends an upward trend with a constructive bullish tone as price holds well above the 50-day, 100-day, and 200-day Exponential Moving Averages (EMAs), which all trail the market and reinforce the underlying uptrend. The Moving Average Convergence Divergence (MACD) indicator is in positive territory on the daily chart, signaling bullish momentum, while the Relative Strength Index (RSI) sits around 63, suggesting firm upside momentum without yet signaling overstretched conditions.
On the topside, the next notable structural hurdle is the R1 Pivot Point resistance at $45.52, followed by the broader descending trendline resistance close to the $50 mark; a sustained break above that area would be needed to open a more aggressive bullish leg in the medium term.
On the downside, initial support is aligned with the rising trend-line region near $40.00, followed closely by the 50-day EMA around $39.76, with deeper demand seen at the 100-day EMA near $37.45 and the 200-day EMA around $36.45 should a larger pullback unfold.
(The technical analysis of this story was written with the help of an AI tool.)
Author

Vishal Dixit
FXStreet
Vishal Dixit holds a B.Sc. in Chemistry from Wilson College but found his true calling in the world of crypto.