Has Ethereum begun a reversal in March? Data reveals key signals

The price of Ethereum recovered above $2,000 while negative news about the war continued to spread. At one point, the price reached $2,200, the highest level since February 5. However, this move may not be enough to confirm a reversal.
Recent Ethereum trading data explains why risks remain significant in March.
Ethereum Remains in a volatile range driven by speculative sentiment
According to data from CryptoQuant, ETH trading volume on Binance over the past 30 days reached about 29.6 million ETH. This is the highest level since September last year.
Meanwhile, the ETH supply currently held on Binance is only about 3.5 million ETH. Recent data also shows that ETH supply on exchanges has declined sharply. More than 31.6 million ETH were withdrawn from exchanges in February 2026. This marks the highest outflow level since November of the previous year.
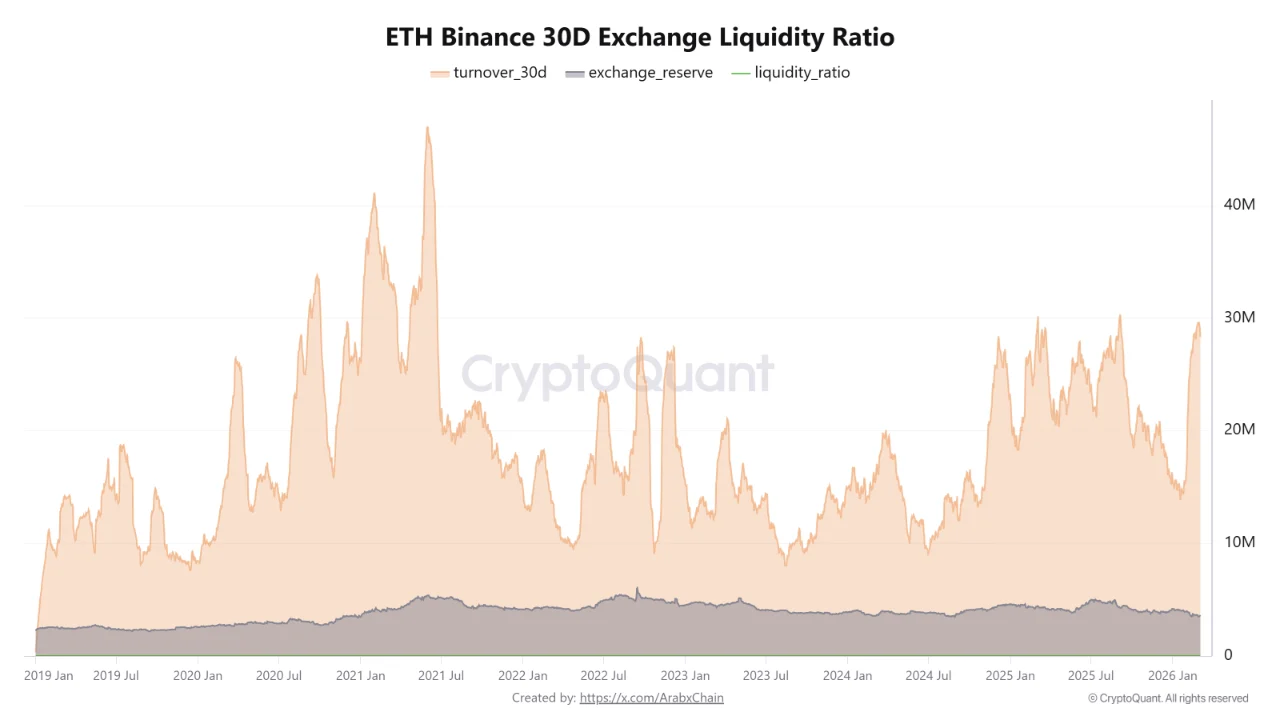
TH Trading Volume & Exchange Reserve on Binance. Source: CryptoQuant
As a result, the Liquidity Ratio surged to around 8.47. Analysts calculate this metric by dividing trading volume during a period by the actual supply available on exchanges. The indicator reflects how intensively the existing ETH supply is being “used.”
A level of 8.47 indicates that the same amount of ETH is being traded repeatedly within a short period. Traders rotate the same liquidity instead of executing one-directional transactions.
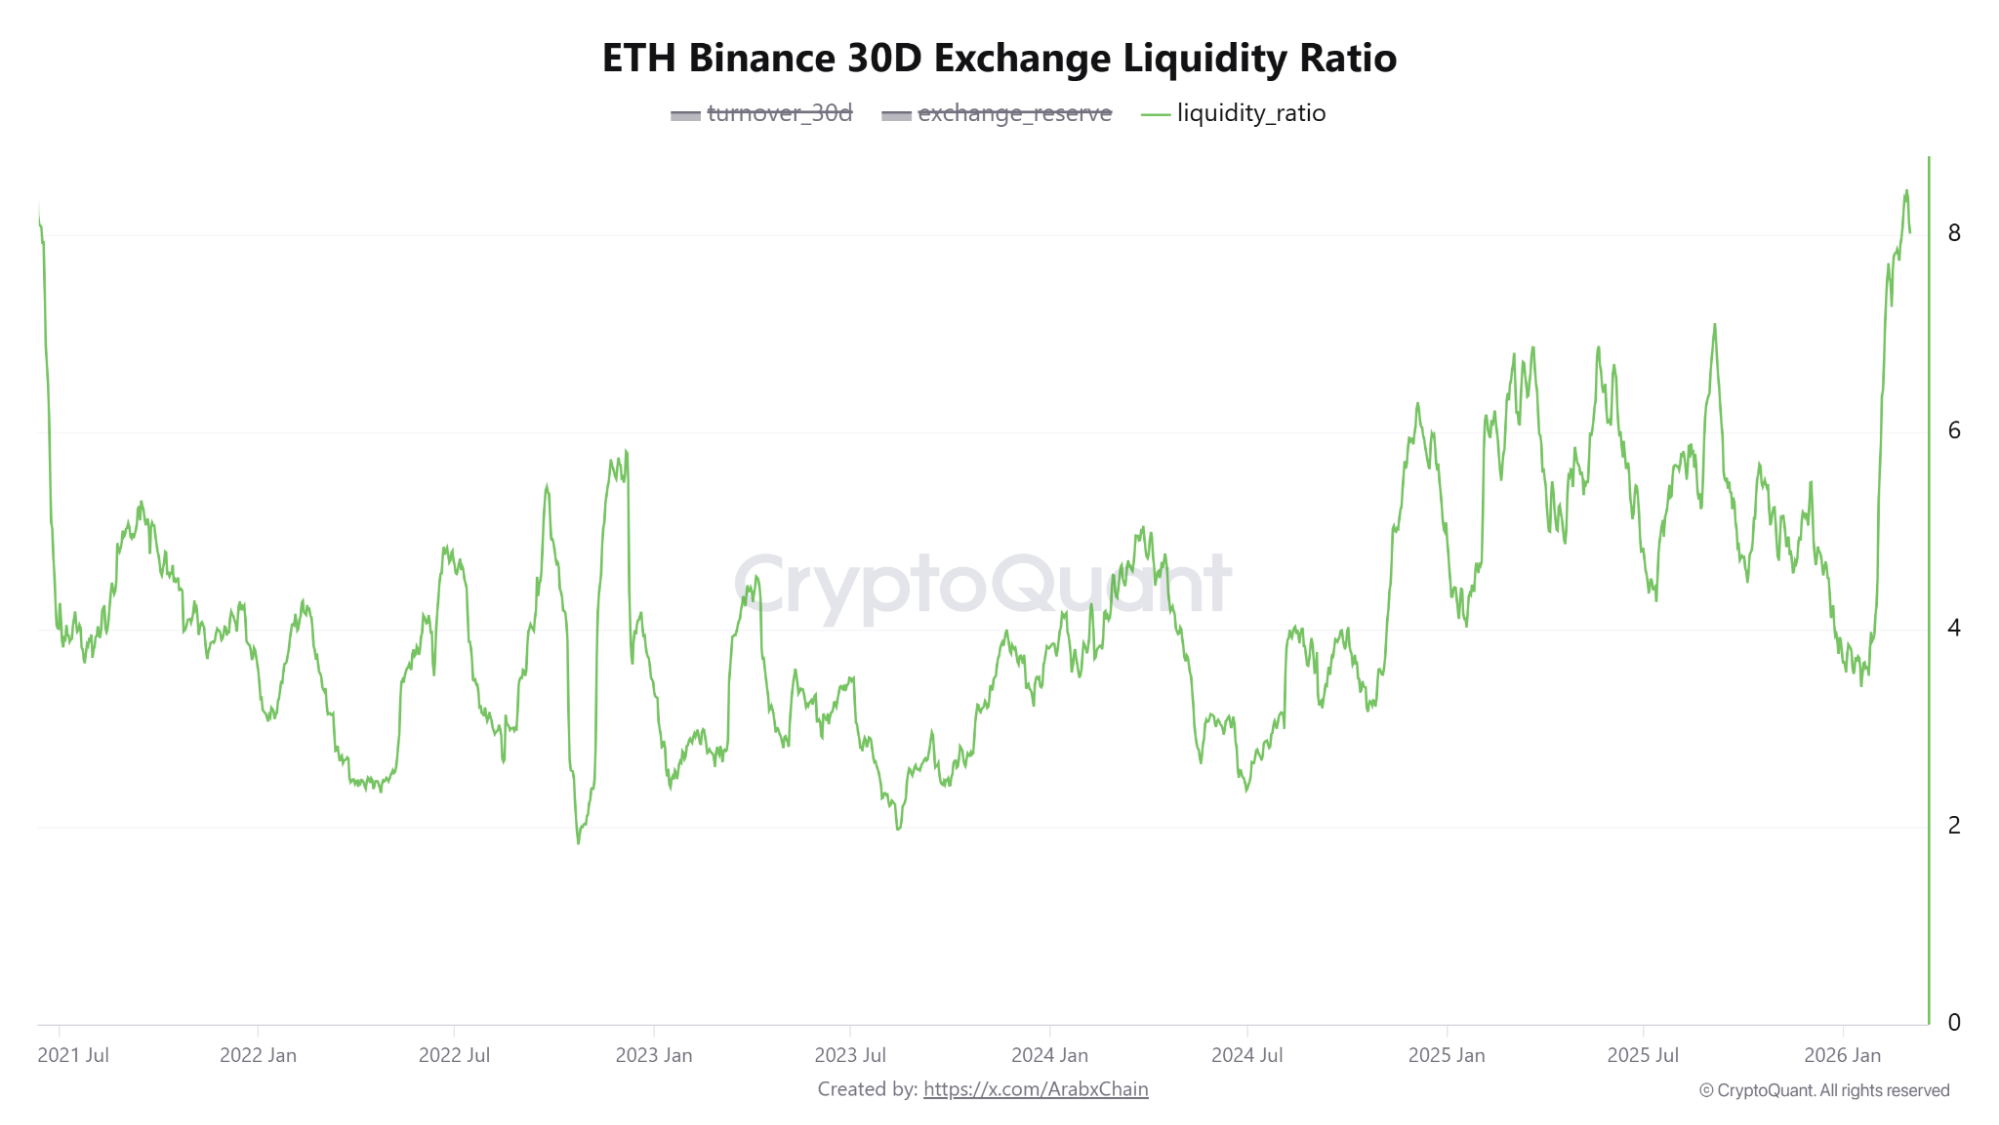
Ethereum Liquidity Ratio on Binance. Source: CryptoQuant.
Analyst Arab Chain from CryptoQuant explained that this pattern reflects extremely active trading, largely driven by speculation.
Traders may be executing short-term orders, scalping strategies, or using ETH as collateral in derivatives markets such as futures and perpetual contracts. These strategies can cause trading volume to surge even without a large increase in real supply.
“This pattern often emerges during periods of significant price volatility or when the market is undergoing a repositioning phase among investors,” Arab Chain explained.
Arab Chain also added that historically, periods of high Liquidity Ratio often coincide with strong price volatility, improving market liquidity, and a rising risk appetite among investors.
As a result, short-term trading sentiment and the pursuit of quick derivative profits may create an environment that triggers liquidations for traders.
While many analysts remain optimistic after ETH broke above $2,000, market analyst IncomeSharks believes it may still be too early for bulls to celebrate.
The ETH/USD daily chart he shared shows ETH trading below the SuperTrend line near $2,230, which currently acts as strong resistance.
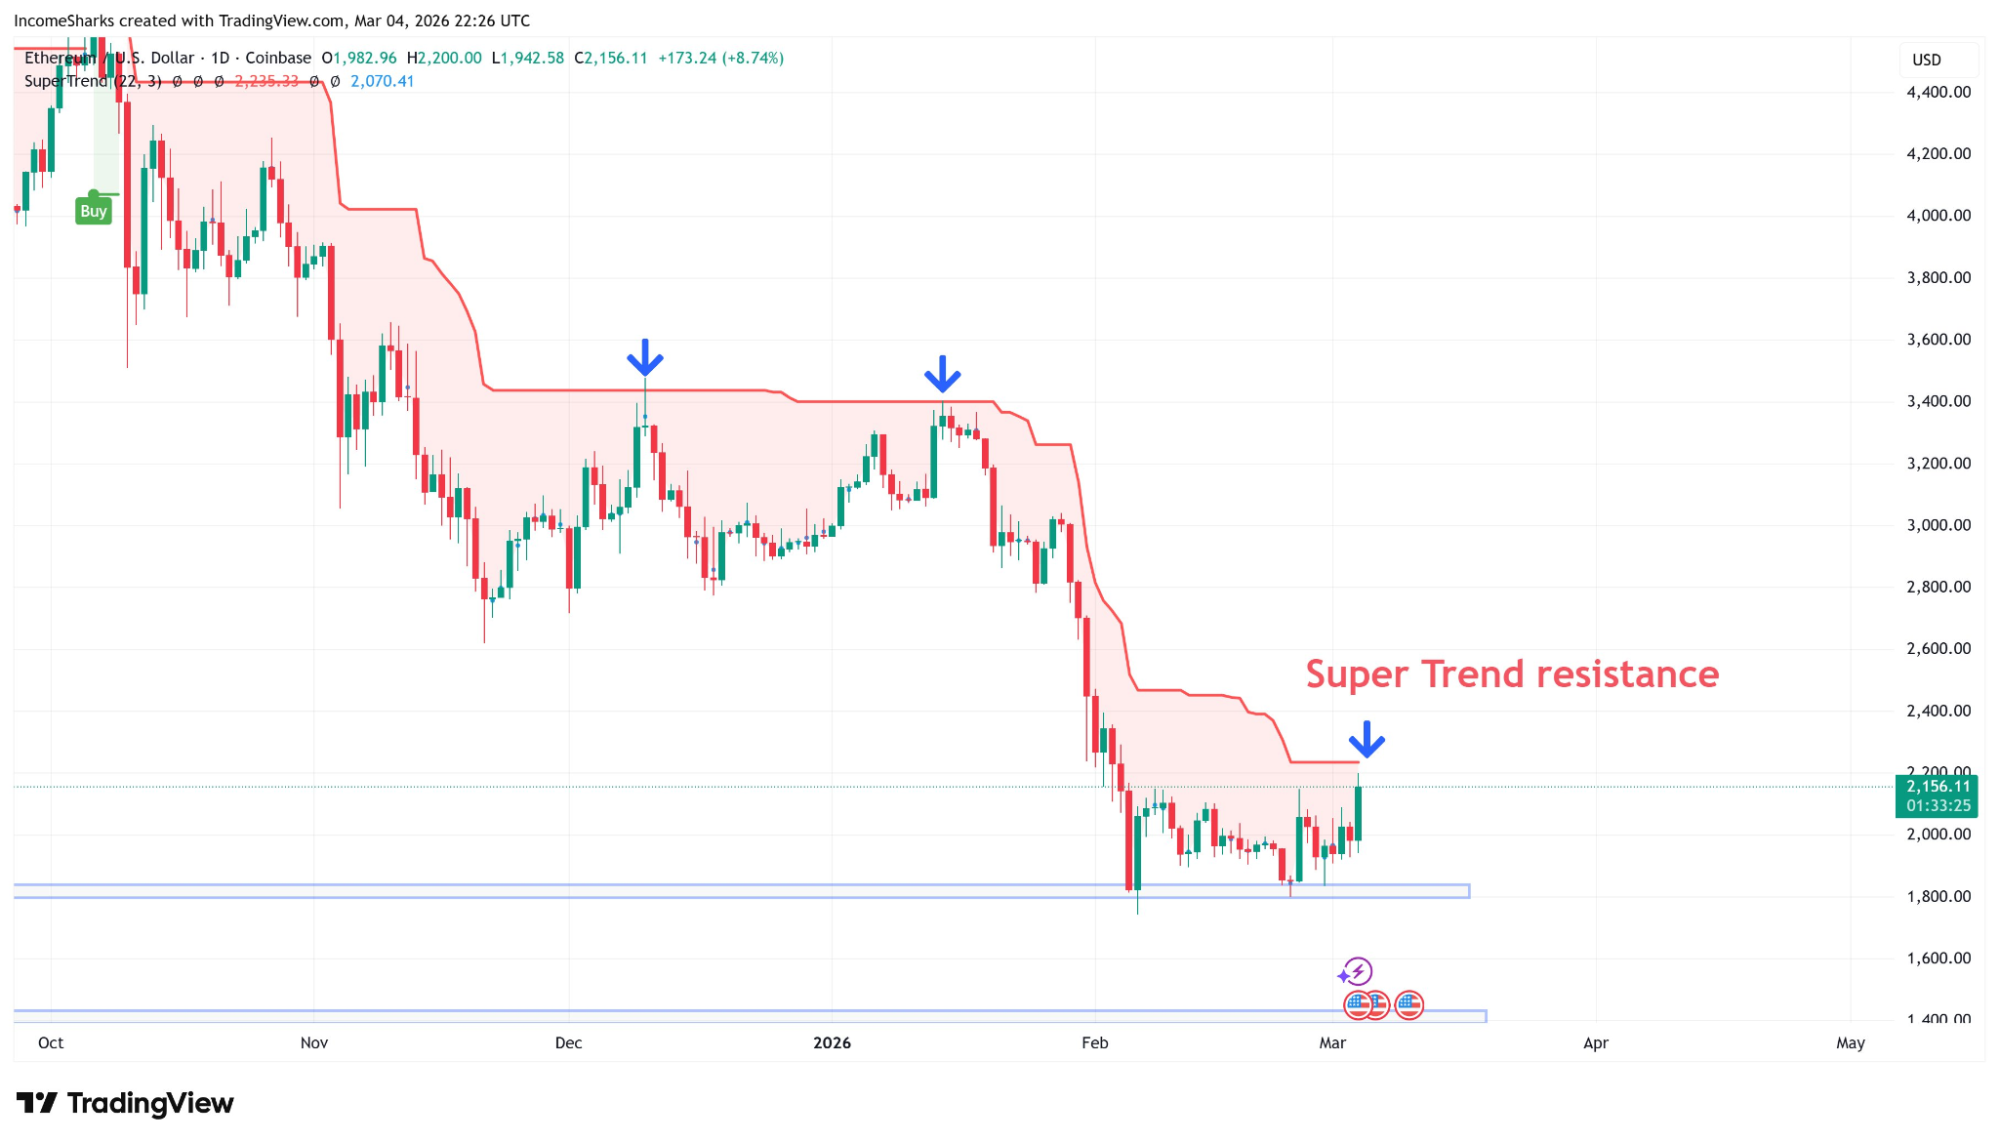
Ethereum Price Structure vs. Super Trend. Source: IncomeSharks
“A nice daily candle is good to see but means nothing if it's not followed by more. The bulls can celebrate on a close of the SuperTrend or after we see follow through,” IncomeSharks stated.
These observations suggest that excessive optimism about an Ethereum reversal in March could harm investors.
According to the latest analysis from BeInCrypto, Ethereum must close above $2,140 to officially exit the sideways phase that has lasted since early last month. Otherwise, the price could decline to lower levels
Author

BeInCrypto
BeInCrypto
Since 2018, BeInCrypto has grown into a leading global crypto news platform. Through our award-winning journalism and close ties with industry leaders, we deliver trusted insights into Web3, AI, and digital assets.