Harmony Price Prediction: ONE hangs by a thread
- Harmony price has been stuck in a bullish pennant since November.
- ONE price action reversed to the downside after being rejected by the 55-day SMA.
- Expect an intermediary trend line to hold with bulls pushing price action back to $0.26.

Harmony (ONE) price has been in a longer term bullish pennant price pattern since the beginning of November, which has unfolded between the red descending trend line and the ascending green trend line that runs along with the 200-day Simple Moving Average. An intermediary black ascending trend line has been hugging the uptrend these past few days but faces a firm test after bulls recently got rejected by the 55-day SMA at $0.26. Expect the black ascending trend line and the S1 support to hold, providing support for bulls and enabling them to push price action back up higher towards $0.28.
ONE bulls look beyond the 55-day and SMA and target $0.28
Harmony price is going into a longer-term squeeze, with lower highs and higher lows grinding towards each other very slowly. Although the pennant only looks to be unfolding into 2022, inside the pennant, another story is playing with bulls defending the intermediary black ascending trend line and the monthly S1 support at $0.20. Bulls got pushed back against this level after trying to break the 55-day Simple Moving Average (SMA) at $0.26. As bulls saw their efforts paired back in full today, expect this session to be make-or-break to keep the short-term rally going.
ONE bulls will try to defend this level from now on, and the general outcome is likely to be a bullish breakout from the pennant, with market conviction positive for cryptocurrencies overall going into 2022. Expect bears to use current headwinds to weigh in on the price action, but bulls will want to defend going into the Christmas break. A bounce would quickly see a retest and break of the 55-day SMA, leading to a touch of the price target at $0.28, with the monthly pivot as a profit-taking target within the pennant.
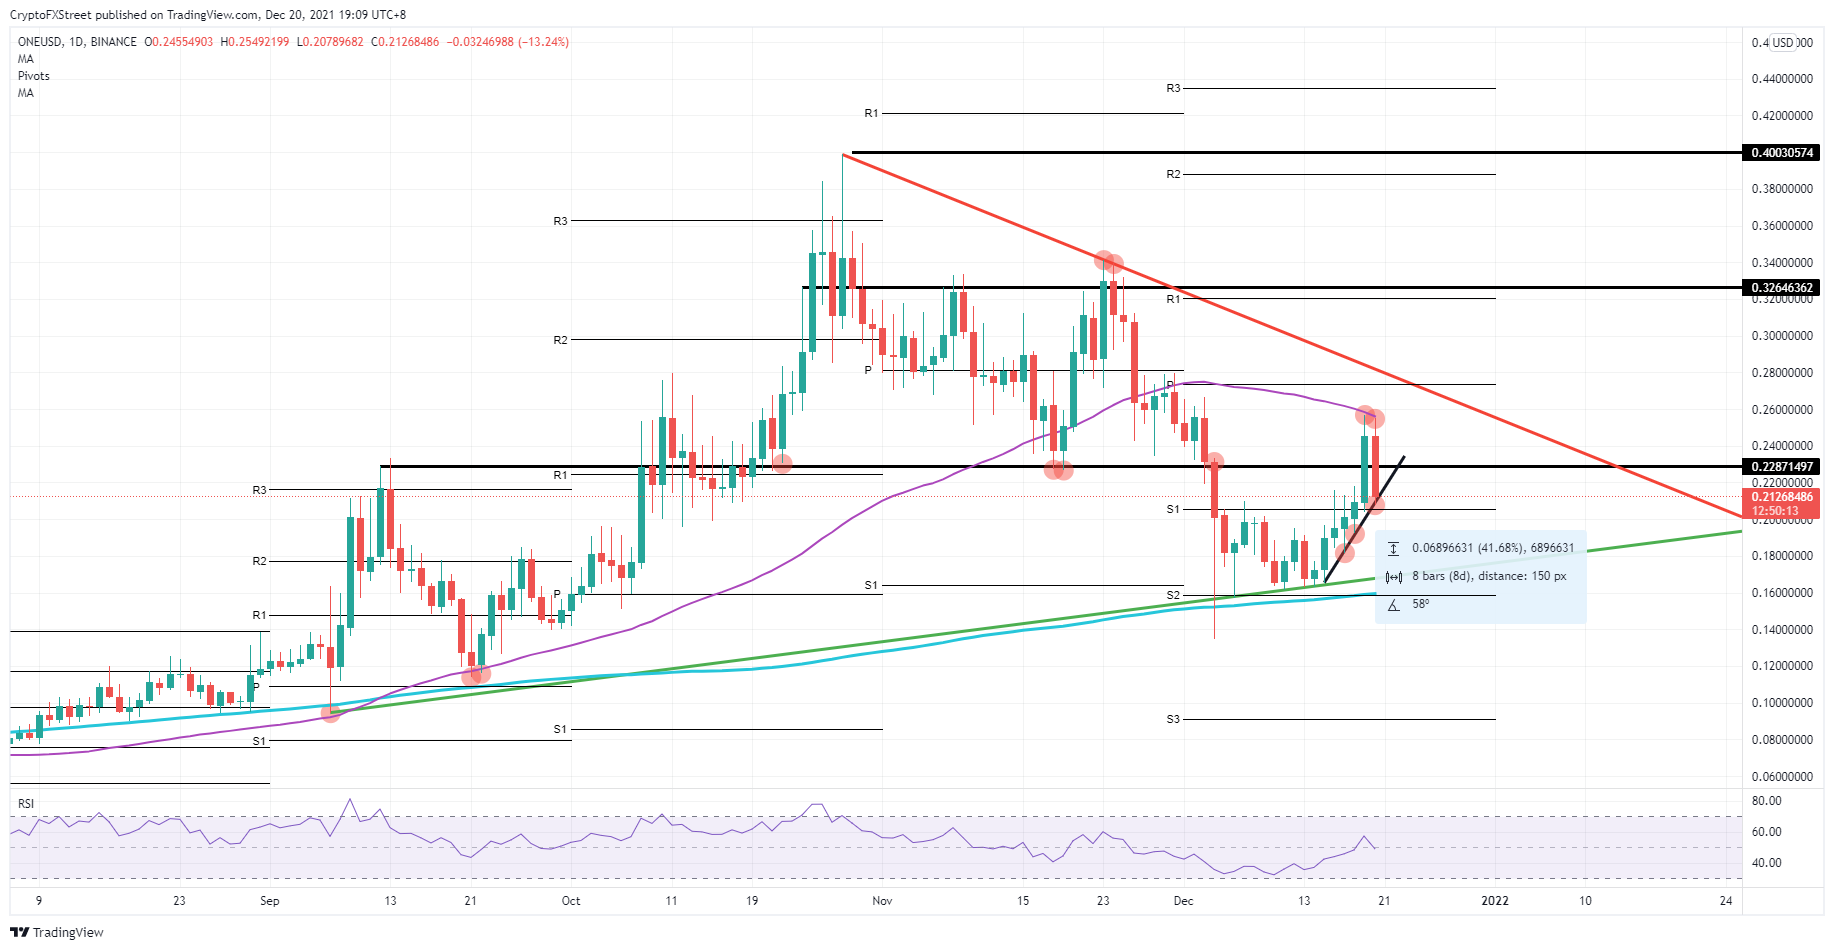
ONE/USD daily chart
If bears successfully penetrate below the black ascending trend line and S1 support level, on the other hand, expect a quick correction down to the green ascending trend line and the 200-day SMA around $0.18. As the S2 monthly support level is just below at $0.16, expect a false break instead of a successful bearish continuation.
Author

Filip Lagaart
FXStreet
Filip Lagaart is a former sales/trader with over 15 years of financial markets expertise under its belt.




