Ethereum Top Price Prediction: After the crash, it must hold onto the critical cushion before Constantinople – Confluence Detector

Cryptocurrencies are falling fast with Ethereum leading the charge, dropping over 10%. The King of Altcoins had surged ahead of the Constantinople upgrade, reaching a trough-to-peak increase of 80% at some point. ETH/USD is paring its gains. Is this a correction that is part of the uptrend? Or a detrimental change of course? Constantinople awaits on January 16th.
The Technical Confluence Indicator shows that Vitalik Buterin's brainchild needs to hold onto critical support at $131 which is the convergence of last week's low and the Fibonacci 38.2% one-month. Both are potent lines.
If now, it has only weak support lines around $126 and $120.
Looking up, initial resistance awaits at $139 where we see the confluence of the Pivot Point one-month Support 1, the previous 1h-high, and the Bollinger Band one-day Middle. The next line is $143 where we see the Fibonacci 23.6% one-month and the Bollinger Band 4h-Lower.
The next level is $150 which is a dense cluster including the Simple Moving Average 5-4h, the SMA 50-15m, and the Fibonacci 38.2% one-week. $153 is the last level to watch. It is the meeting point of the Fibonacci 61.8% one-day and the Fibonacci 23.6% one-week.
Click to see the Full Confluence Indicator
Here is how it looks on the tool:
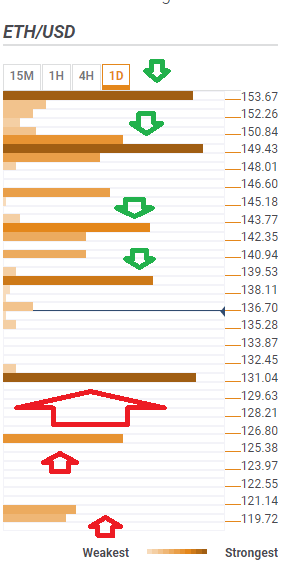
The Confluence Detector finds exciting opportunities using Technical Confluences. The TC is a tool to locate and point out those price levels where there is a congestion of indicators, moving averages, Fibonacci levels, Pivot Points, etc. Knowing where these congestion points are located is very useful for the trader, and can be used as a basis for different strategies.
Get 24/7 Crypto updates in our social media channels: Give us a follow at @FXSCrypto , and our FXStreet Crypto Trading Telegram channel
This tool assigns a certain amount of “weight” to each indicator, and this “weight” can influence adjacents price levels. These weightings mean that one price level without any indicator or moving average but under the influence of two “strongly weighted” levels accumulate more resistance than their neighbors. In these cases, the tool signals resistance in apparently empty areas.
Author

Yohay Elam
FXStreet
Yohay is in Forex since 2008 when he founded Forex Crunch, a blog crafted in his free time that turned into a fully-fledged currency website later sold to Finixio.



