Ethereum Technical Analysis: ETH/USD squeezed below key near-term support
- Ethereum price is nursing losses in the session on Thursday, down some 3.7%
- ETH/USD bulls were pressed lower and forced to breach a near-term ascending trend line.

ETH/USD 60-minute chart
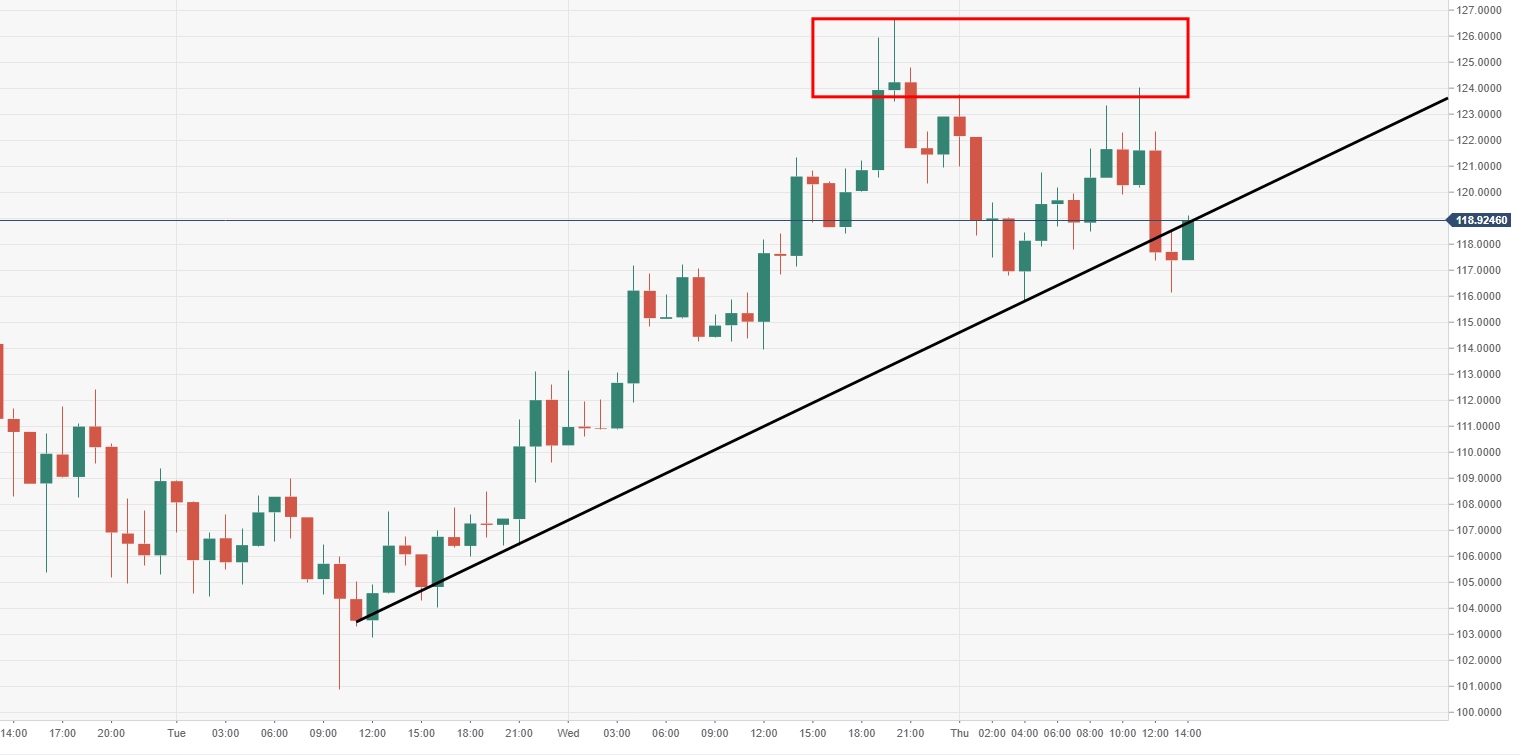
Spot rate: 118.95
Relative change: -3.70%
High: 124.00
Low: 115.81
Trend: Bearish
Support 1: 113.12, daily pivot point support.
Support 2: 103.52, daily pivot point support.
Support 3: 96.78, daily pivot point support.
Resistance 1: 119.00, underneath breached trend line.
Resistance 2: 129.65, daily pivot point resistance.
Resistance 3: 136.39, daily pivot point resistance.
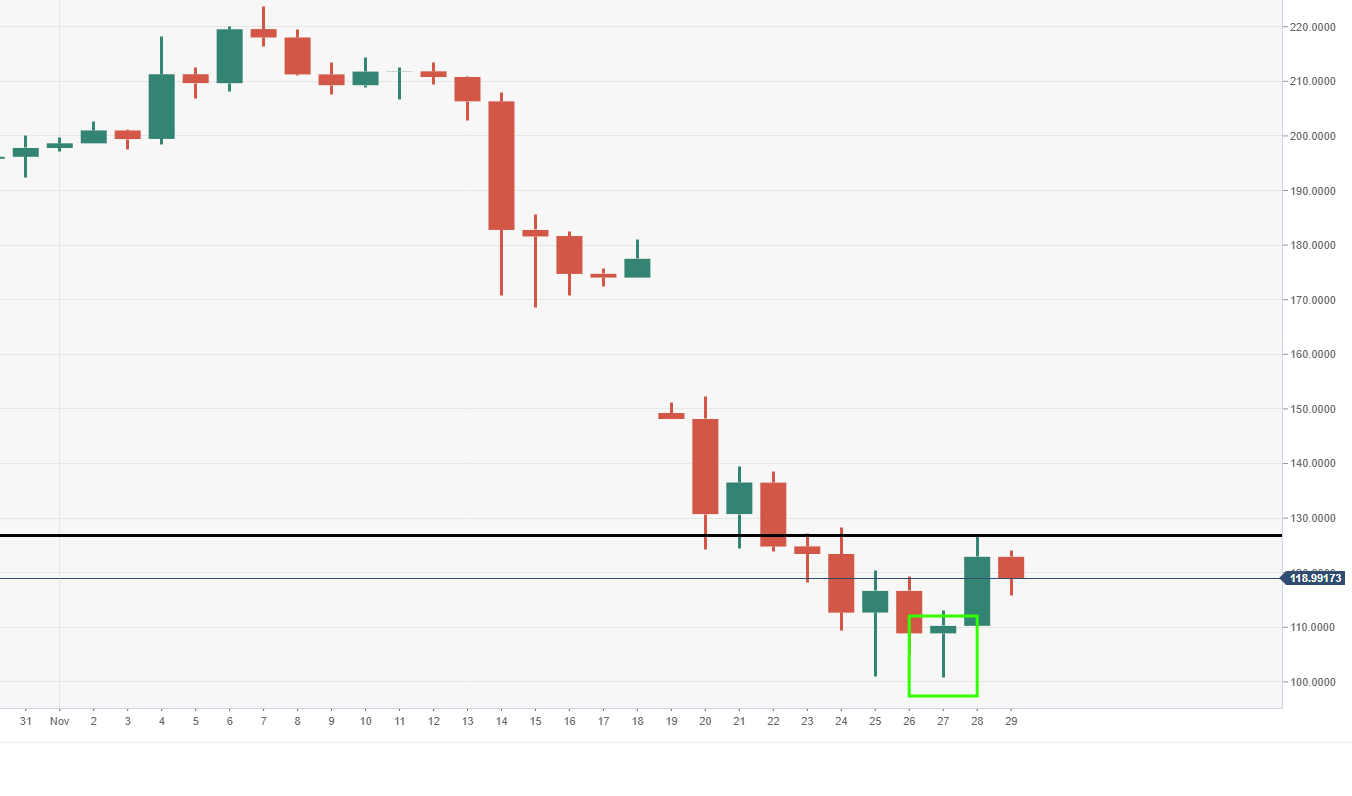
ETH/USD daily chart
- Following the reversal doji candlestick, upside still looks promising, there is resistance in the way heading into $130. A top area for 23, 24 and 28 November.
Author

Ken Chigbo
Independent Analyst
Ken has over 8 years exposure to the financial markets. He started his career as an analyst, covering a variety of asset classes; forex, fixed income, commodities and equities.


