Ethereum technical analysis: ETH/USD bearish flag structure breakout allows sellers to capitalize
- Ethereum price is trading in the red, down 0.15% the session on Monday.
- ETH/USD has fallen over $50 within the last six weeks of trading.
- The price runs the risk of the psychological $100 mark being tested to the downside.

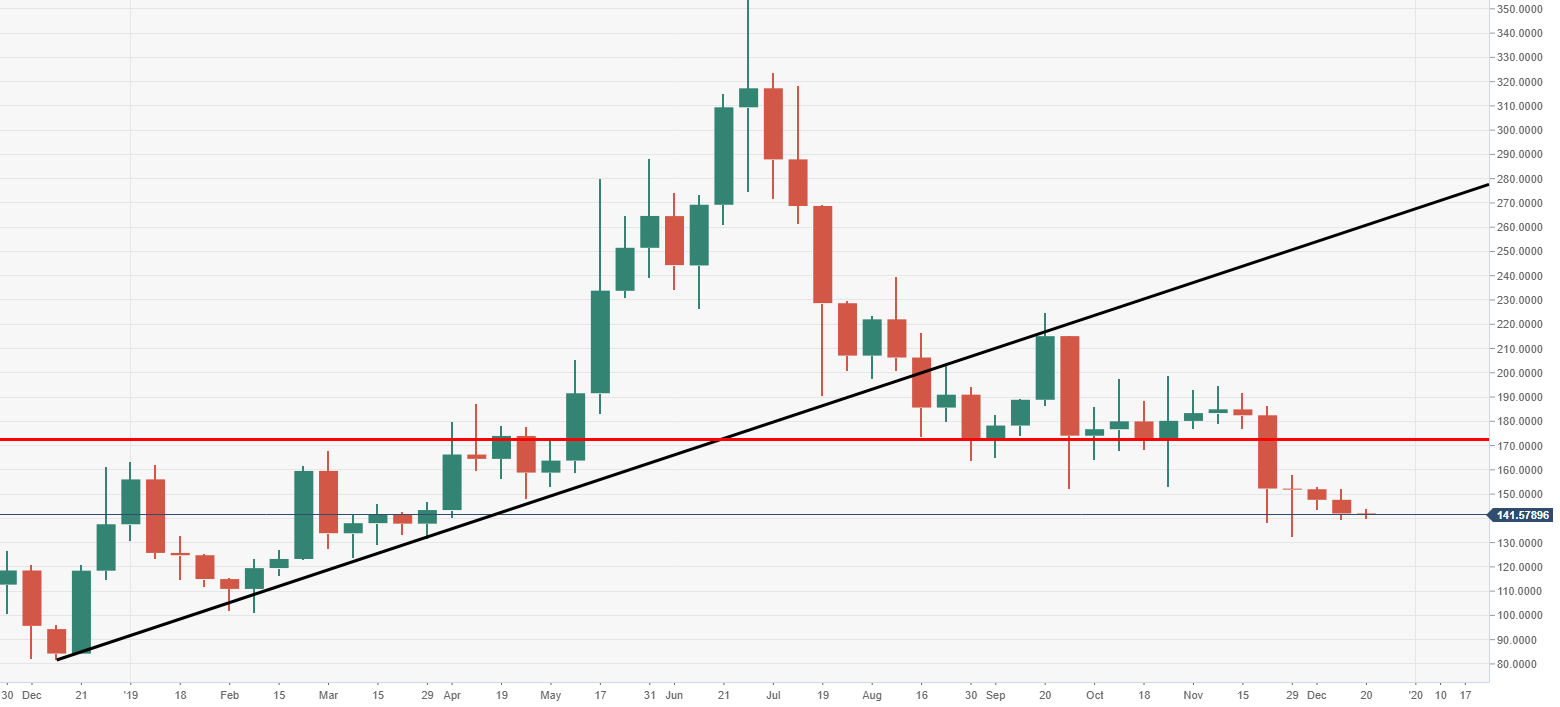
ETH/USD weekly chart
Price action is running towards its sixth consecutive week in the red, as the bears maintain full control in current trend.
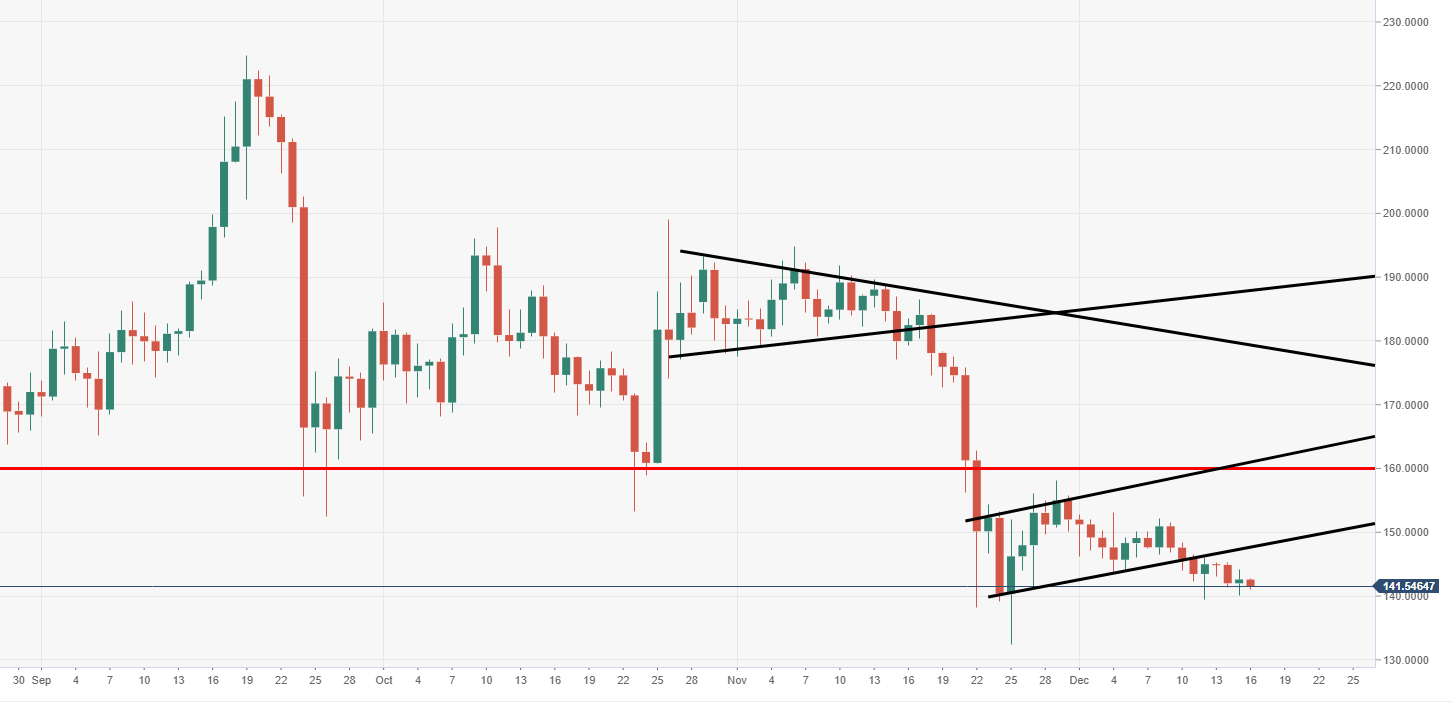
ETH/USD daily chart
Near-term price action is subject to further downside risks, after breaching bearish flag.
Spot rate: 140.63
Relative change: -1.10%
High: 142.53
Low: 139.86
Author

Ken Chigbo
Independent Analyst
Ken has over 8 years exposure to the financial markets. He started his career as an analyst, covering a variety of asset classes; forex, fixed income, commodities and equities.
More from Ken Chigbo


