Ethereum: Forecasting the rally after a double three pattern

In this technical article, we will review the Elliott Wave forecast for Ethereum (ETHUSD) that we recently presented to our members.
ETHUSD developed a clear three-wave correction that completed as an Elliott Wave Double Three pattern. After reaching the expected support area, Ethereum found buyers and started a strong rally. This is the type of setup we look for in our daily market analysis. We identify the corrective structure, define the key support zone, and prepare for the next move before the market reacts.
In this article, we will explain the Double Three pattern, review the ETHUSD forecast, and highlight the next upside targets.
Elliott Wave double three pattern
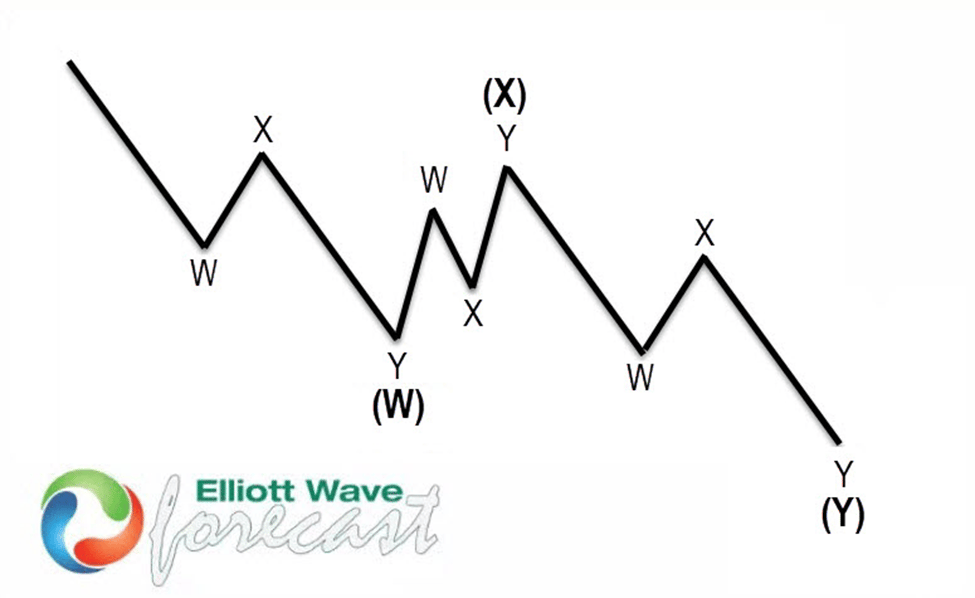
The Double Three is a common Elliott Wave corrective pattern. It is useful for traders because it can provide a clear completion area and a well-defined invalidation level. The pattern is labeled (W)-(X)-(Y) and has a 3-3-3 structure. This means that each main leg develops as a corrective sequence. Waves (W) and (Y) usually form as three-wave structures, such as A-B-C or another W-X-Y combination. Wave (X) connects the two corrections. When the structure is clear, traders can use Fibonacci measurements to identify the area where the correction may end. This can help create a trading plan before the next rally begins.
ETH/USD Elliott Wave one-hour chart 09.02.2026
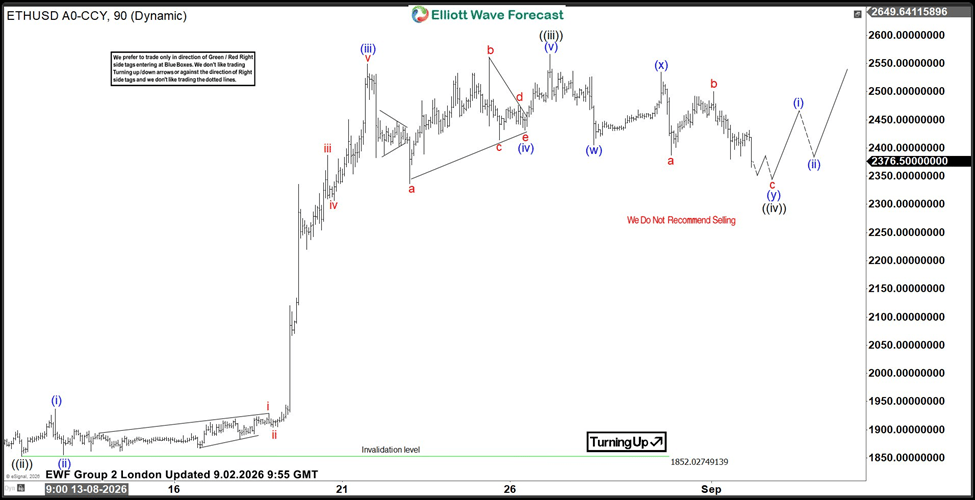
ETHUSD is forming a three-wave pullback, unfolding as an Elliott Wave Double Three pattern. We can identify clear three-swing corrective structures within each leg of the pattern.
At the moment, Ethereum is developing the c red leg of wave (y). As our members know, when a Double Three pattern is in progress, we use the Fibonacci extension tool to measure the Equal Legs area and identify a potential buying zone.
In this case, we are projecting wave (w) from the end of wave (x). This gives us the ideal support area at 2375–2337, which represents buying zone.
From this area, we expect ETHUSD to find buyers and rally toward new highs. Alternatively, we should see at least a three-wave bounce from the support zone.
ETH/USD Elliott Wave one-hour chart 09.04.2026
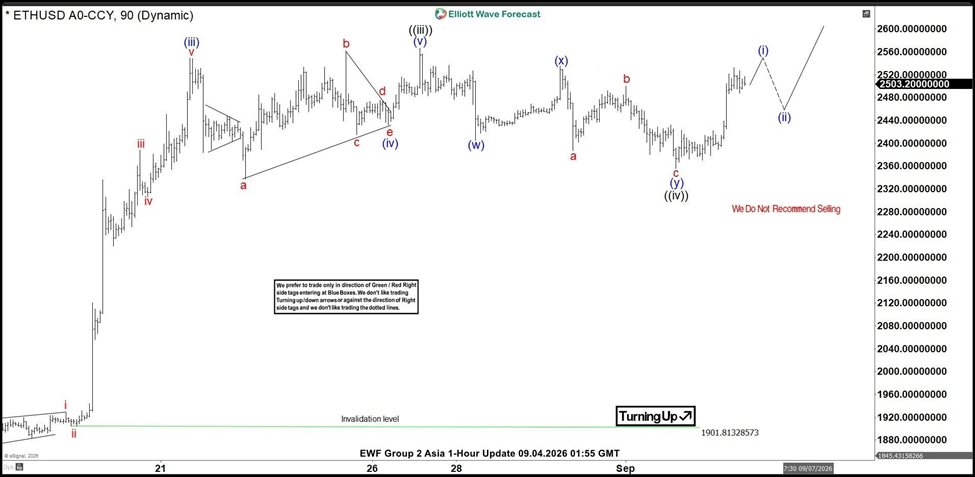
ETHUSD found buyers at the Equal Legs zone as expected, producing a solid bounce. While the price remains above the latest low at 2355, we can count wave ((iv)) black as completed. Wave ((v)) may now be in progress, opening the door for another push toward new highs. The next upside target comes in around the 2618+ area.
This is a good example of how we use Elliott Wave structure and Fibonacci measurements to define key trading areas in advance, giving our members a clear roadmap before the market makes its next move.
Author

Elliott Wave Forecast Team
ElliottWave-Forecast.com