Ethereum Elliott Wave technical analysis [Video]
![Ethereum Elliott Wave technical analysis [Video]](https://editorial.fxstreet.com/images/Markets/Currencies/Digital Currencies/Ethereum/Ethereum_Coins_31_03.jpg)
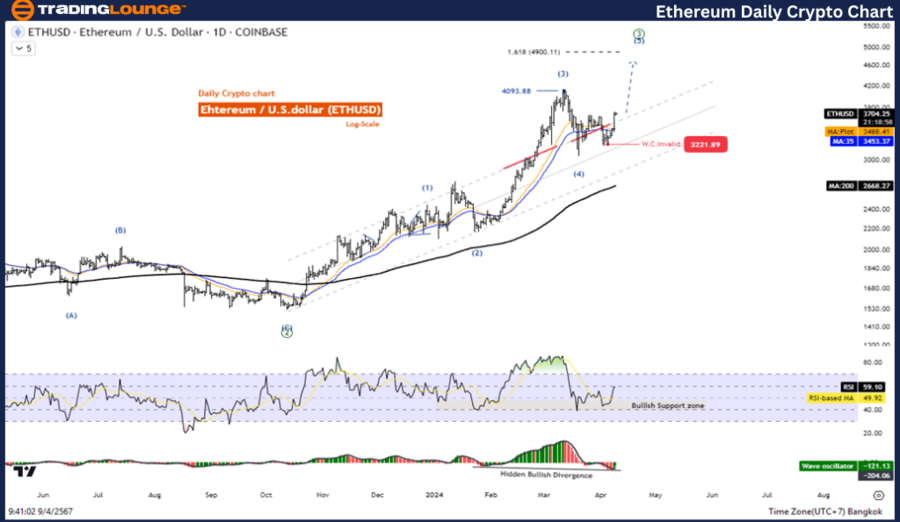
ETH/USD Elliott Wave technical analysis
Function: Follow Trend.
Mode: Motive.
Structure: Impulse.
Position: Wave (5).
Direction next higher degrees: wave ((3)).
Details: Wave (4) may be complete and prices increase again in Wave (5).
ETH/USD trading strategy
Ethereum as a whole is moving in an uptrend with an Impulse pattern where the third-wave of the move is now complete. We are currently recovering in the short term from the fourth wave correction. And the price will rise again in the fifth wave. Looking at five opportunities to trade the fifth wave uptrend.
Ethereum/ U.S. dollar(ETHUSD)Technical Indicators: The price is above the MA200 indicating an Uptrend, The Wave Oscillator is a bullish Momentum.
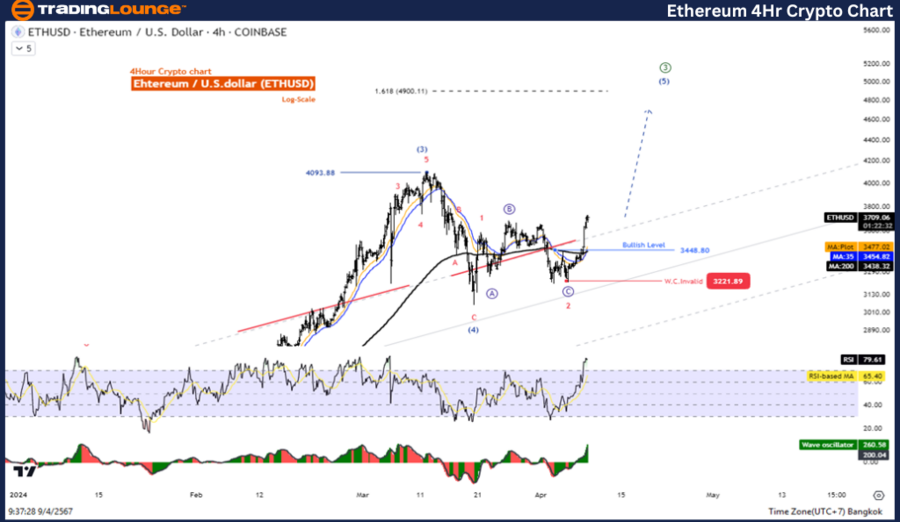
ETH/USD Elliott Wave Analysis four-hour chart
Function: Follow Trend
Mode: Motive
Structure: Impulse
Position: Wave (5)
Direction next higher degrees: Wave ((3))
Details: Wave (4) may be complete and prices increase again in Wave (5)
ETH/USD trading strategy
Ethereum as a whole is moving in an uptrend with an Impulse pattern where the third-wave of the move is now complete. We are currently recovering in the short term from the fourth wave correction. And the price will rise again in the fifth wave. Looking at five opportunities to trade the fifth wave uptrend.
Ethereum/ U.S. dollar(ETHUSD)Technical Indicators: The price is above the MA200 indicating an Uptrend, The Wave Oscillator is a bullish Momentum.
Ethereum Elliott Wave technical analysis [Video]
Author

Peter Mathers
TradingLounge
Peter Mathers started actively trading in 1982. He began his career at Hoei and Shoin, a Japanese futures trading company.


