Dogecoin Price Forecast: Trapped in a descending triangle while DOGE derivatives heat up
- Dogecoin hovers above $0.090 on Friday, extending its tapering consolidation within a descending triangle pattern, capped by the 50-day EMA.
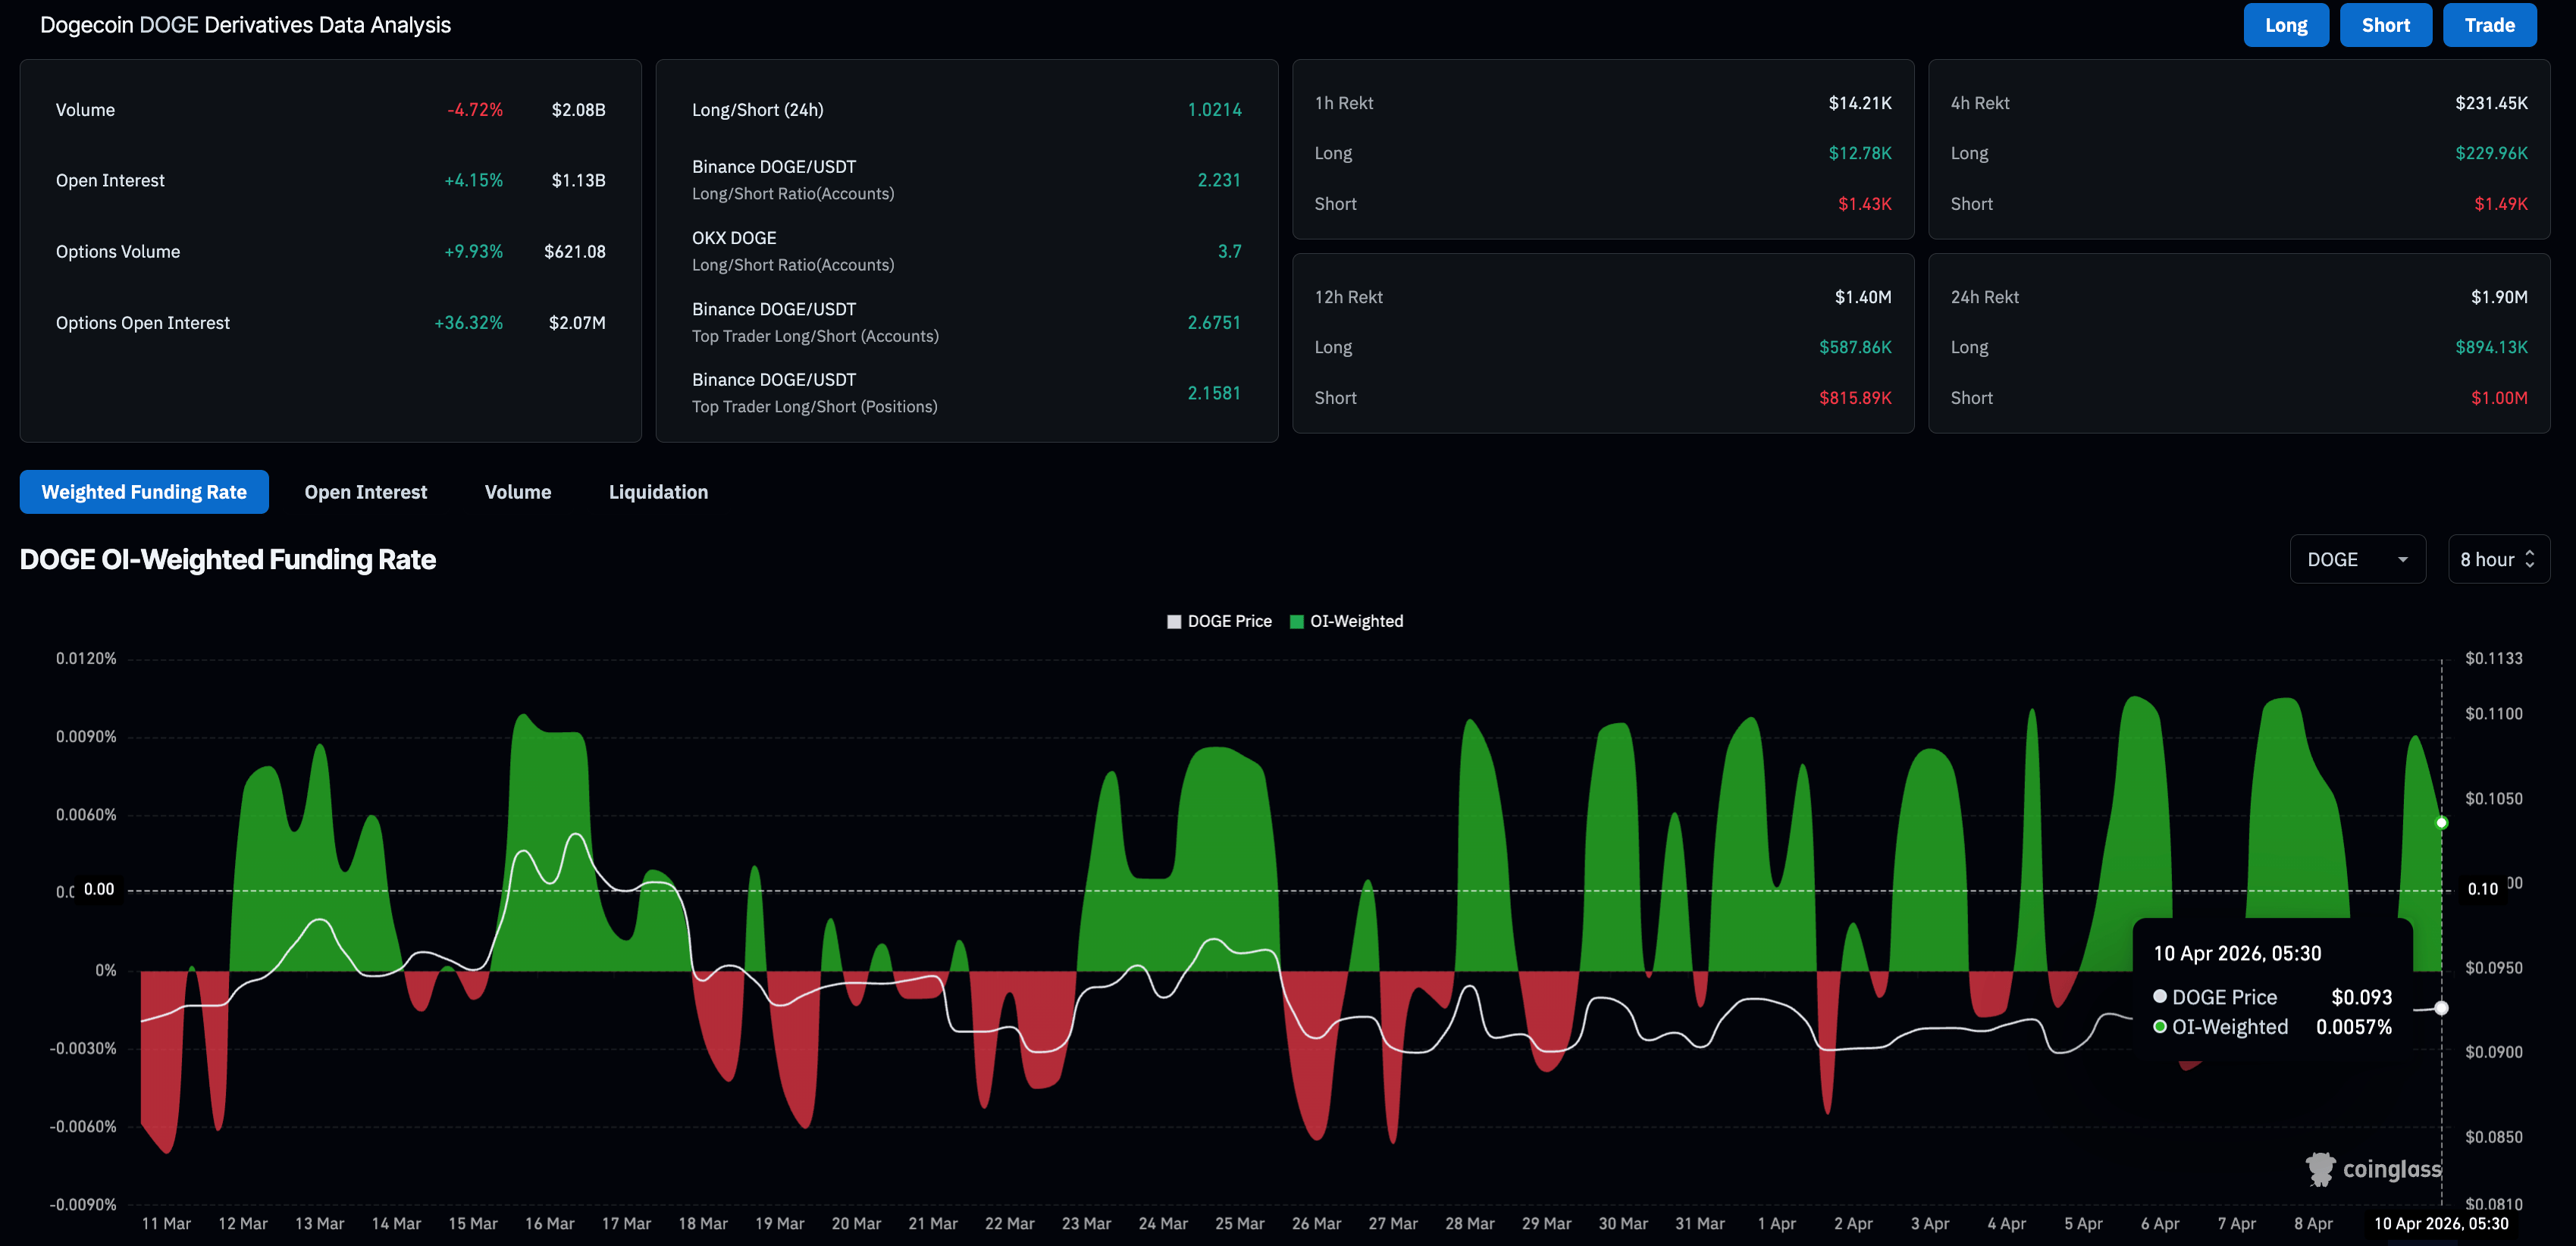
- DOGE Open Interest rises over 4% in 24 hours, suggesting increased activity in the Dogecoin derivatives.
- The technical outlook for Dogecoin is mildly bearish as a descending triangle often leads to a downside breakout.

Dogecoin (DOGE) trades above $0.090 at press time on Friday, facing downside pressure from its 50-day Exponential Moving Average (EMA) and resulting in a descending triangle pattern. The leverage market signals a near-term bullish outlook for the meme coin, as Open Interest rose by over 4% in the last 24 hours. Dogecoin must surpass its 50-day EMA at $0.0961 for an upside reversal.
Bullish bets rise on the original meme coin
Dogecoin is gradually gaining retail strength in the derivatives market, linked to increased activity. Typically, a surge in retail demand is linked to a near-term recovery in meme coins, as speculation arises. CoinGlass data shows a 4.2% surge in DOGE Open Interest (OI) over the last 24 hours to $1.13 billion, suggesting a rise in the notional value of outstanding contracts, which could be driven by increased leverage exposure or positional buildup.
At the same time, the long-to-short ratio is above 1, indicating that a greater number of active long positions outpace bearish bets, and the funding rate of 0.0057% implies a buy-side tilt among traders building new positions.
Dogecoin’s fate remains unknown
Dogecoin shows a tapering consolidation within a descending triangle pattern on the daily chart, with the 50-day EMA reinforcing the upside resistance trendline. The base support for the triangle pattern aligns with the February 11 low at $0.0879.
However, momentum indicators show a mildly constructive setup on the daily chart, as the Moving Average Convergence Divergence (MACD) trails on the upside above its signal line, while the Relative Strength Index (RSI) at 49 hovers close to the midline.
If Dogecoin clears the 50-day EMA at $0.0961, it would open the way to the 100-day EMA at $0.1081.
Looking down, the $0.0879 support floor guards the downside toward the February 6 low at $0.0800. A daily close beneath $0.0879 would confirm the downside breakout of the triangle pattern, reinforcing the downtrend.
(The technical analysis of this story was written with the help of an AI tool.)
Author

Vishal Dixit
FXStreet
Vishal Dixit holds a B.Sc. in Chemistry from Wilson College but found his true calling in the world of crypto.




