Dogecoin Price Forecast: Retail demand supports cautious push toward $0.10
- Dogecoin holds near $0.1000 on Friday, struggling to extend its 4% gains from the previous day.
- Resurfacing retail demand leads to positional buildup in DOGE derivatives, driving Open Interest to $1.39 billion.
- The technical outlook for DOGE is cautiously bullish, targeting the 100-day EMA at $0.1063.

Dogecoin (DOGE) is trading in the red below $0.1000 at press time on Friday, struggling to extend Thursday’s 4% recovery. The original meme coin is regaining retail strength as the broader market risk sentiment improves. Technically, DOGE should surpass its 100-day Exponential Moving Average (EMA) at $0.1063 for an extended recovery.
Dogecoin’s gradual return amid broader market sentiment recovery
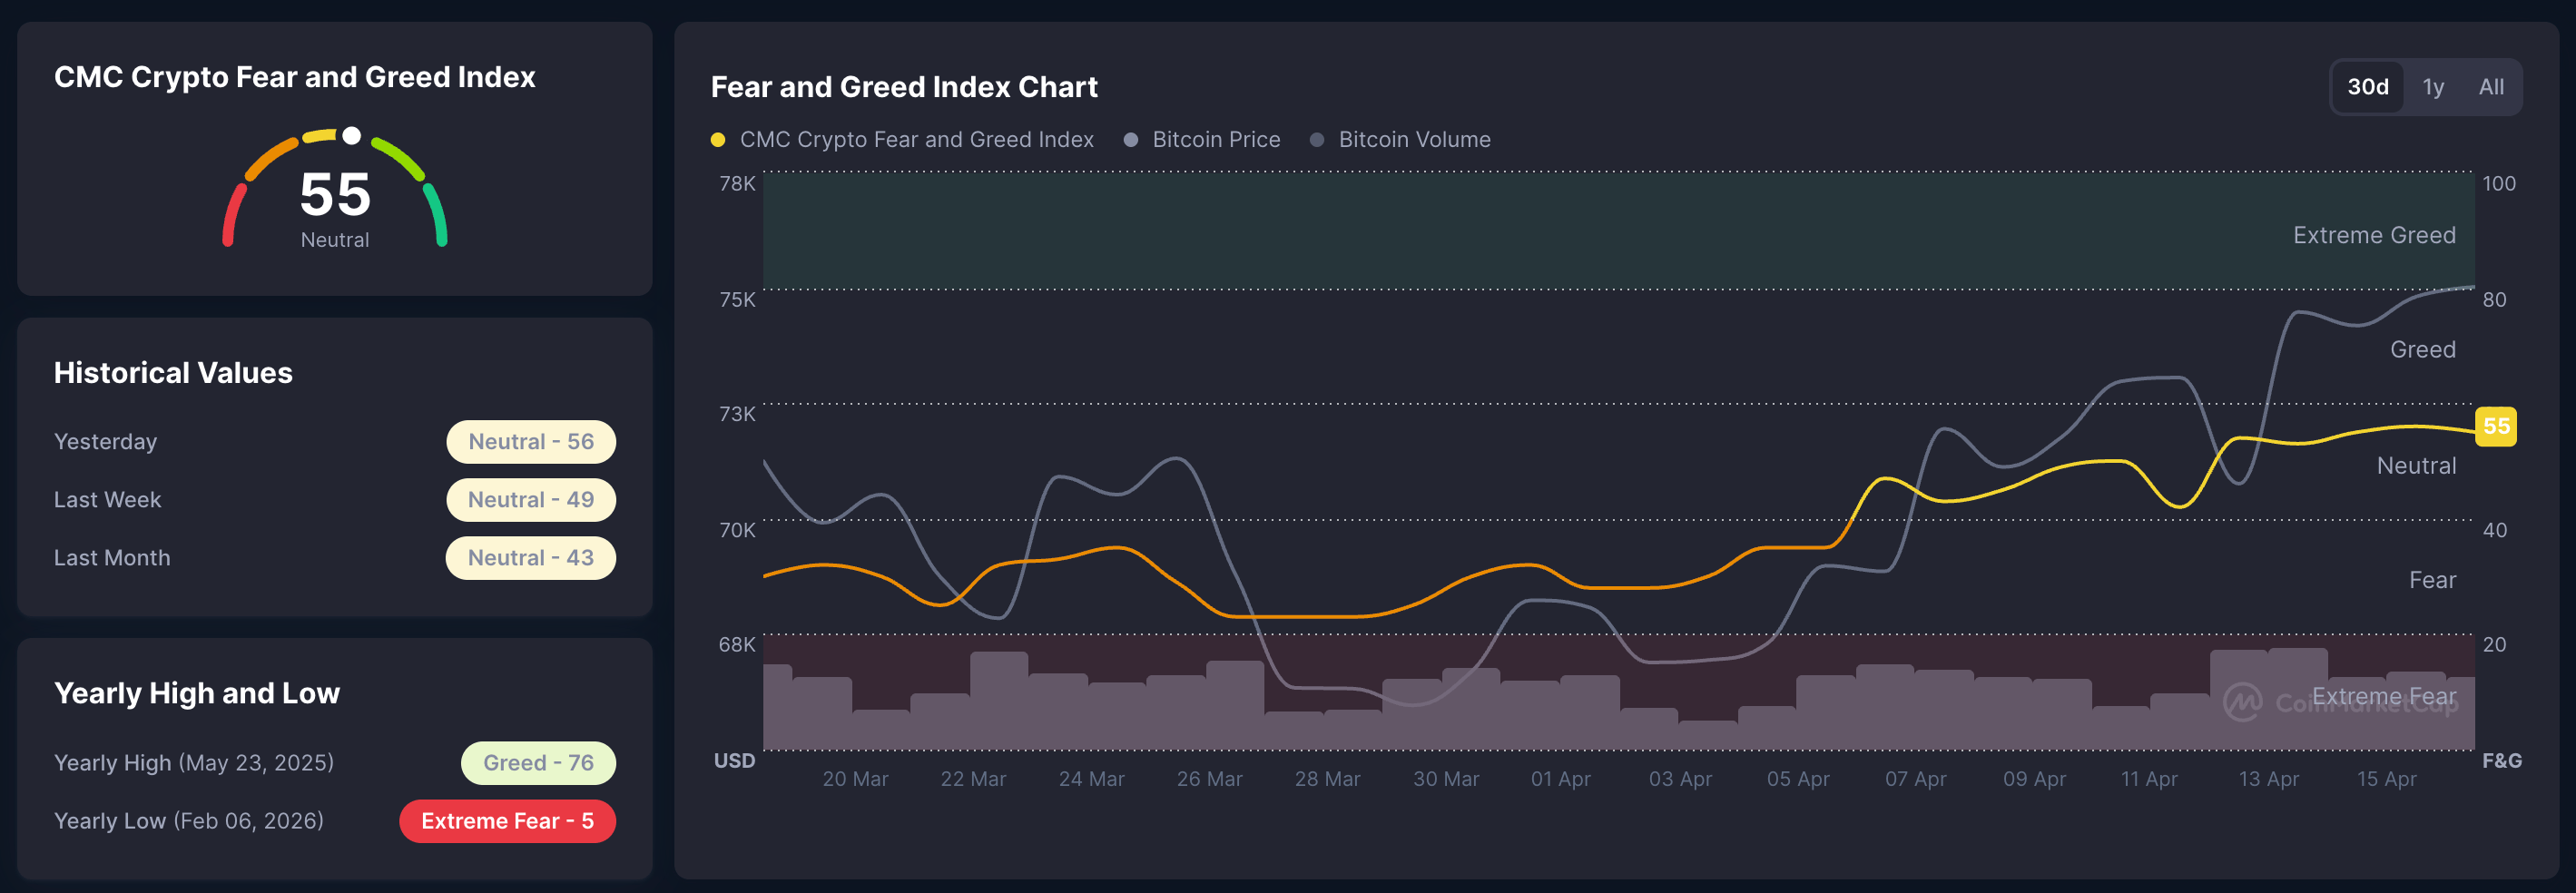
Dogecoin’s demand in the leverage market is heating up as waning risk-off sentiment in the broader market builds retail appetite for meme coins. CoinMarketCap data shows the CMC Fear and Greed Index at 55, hovering at neutral-to-greed levels and up from 32 on April 1, which indicated fear. Typically, a boost in market sentiment creates favorable conditions for meme coins to regain strength.
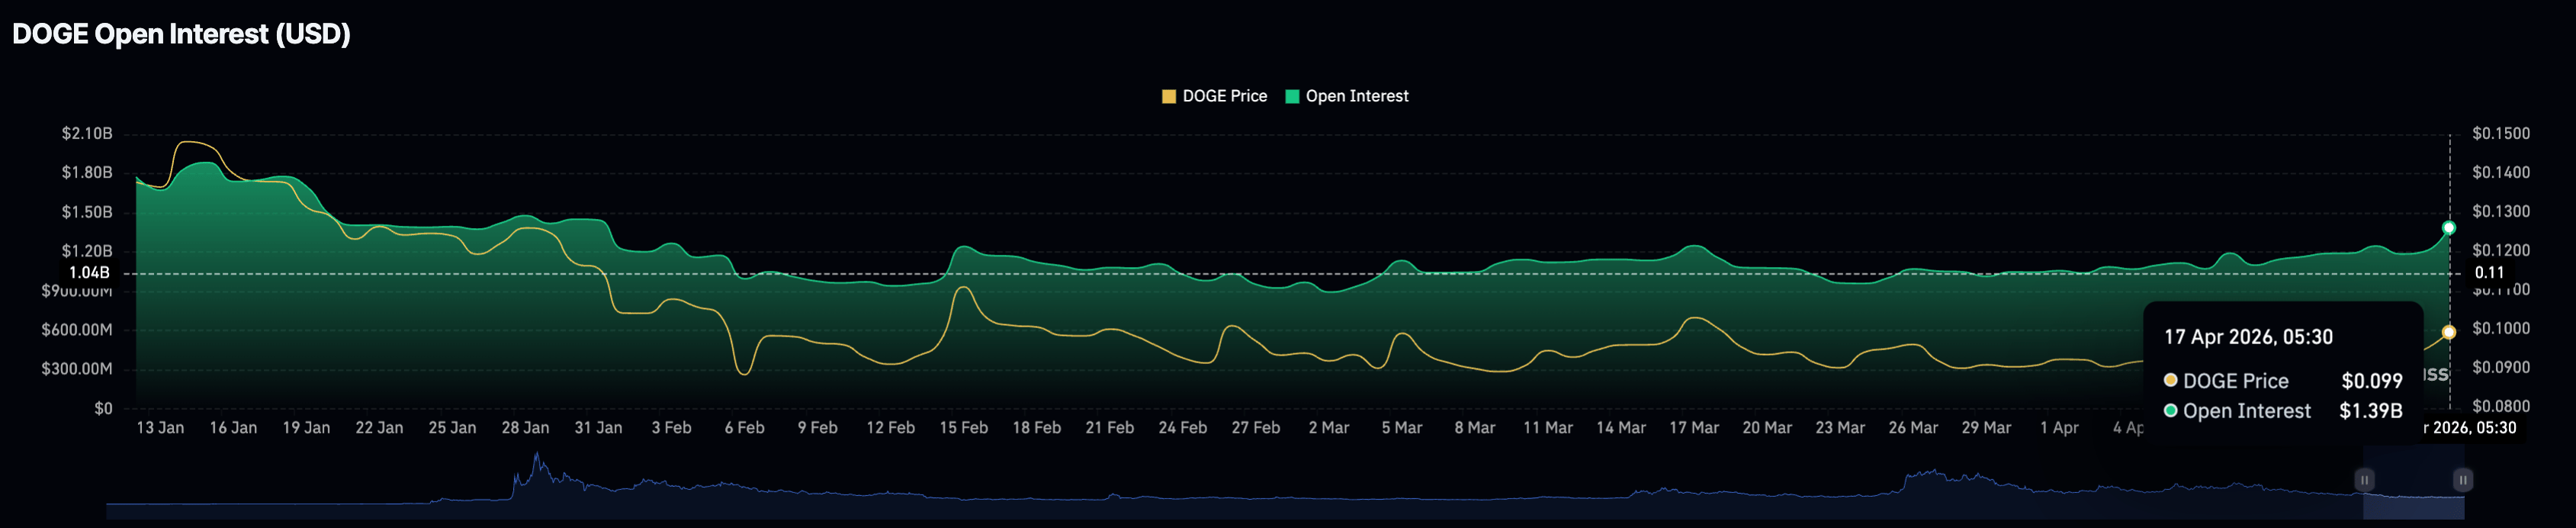
On the derivatives side, a surge in DOGE futures Open Interest (OI) to $1.39 billion, from $1.21 billion on Thursday, reaffirms the renewed risk-driven positional buildup.
Will DOGE extend its rally above $0.10?
Dogecoin holds gains above the recently broken 50-day EMA at $0.09588, suggesting a modestly constructive near-term tone. However, the descending 100-day and 200-day EMAs suggest a broader downtrend.
Momentum indicators back the near-term improvement, with the Relative Strength Index (RSI) near 60 rising above its midline on the daily chart. At the same time, the Moving Average Convergence Divergence (MACD) marginally crosses above the zero line, with positive histogram bars, hinting that buyers are regaining the upper hand.
On the topside, initial resistance is aligned with the 100-day EMA near $0.1063, and a daily close above this barrier would open the way toward the more meaningful resistance level marked by the December 31 low at $0.1161 and the 200-day EMA at $0.1290.
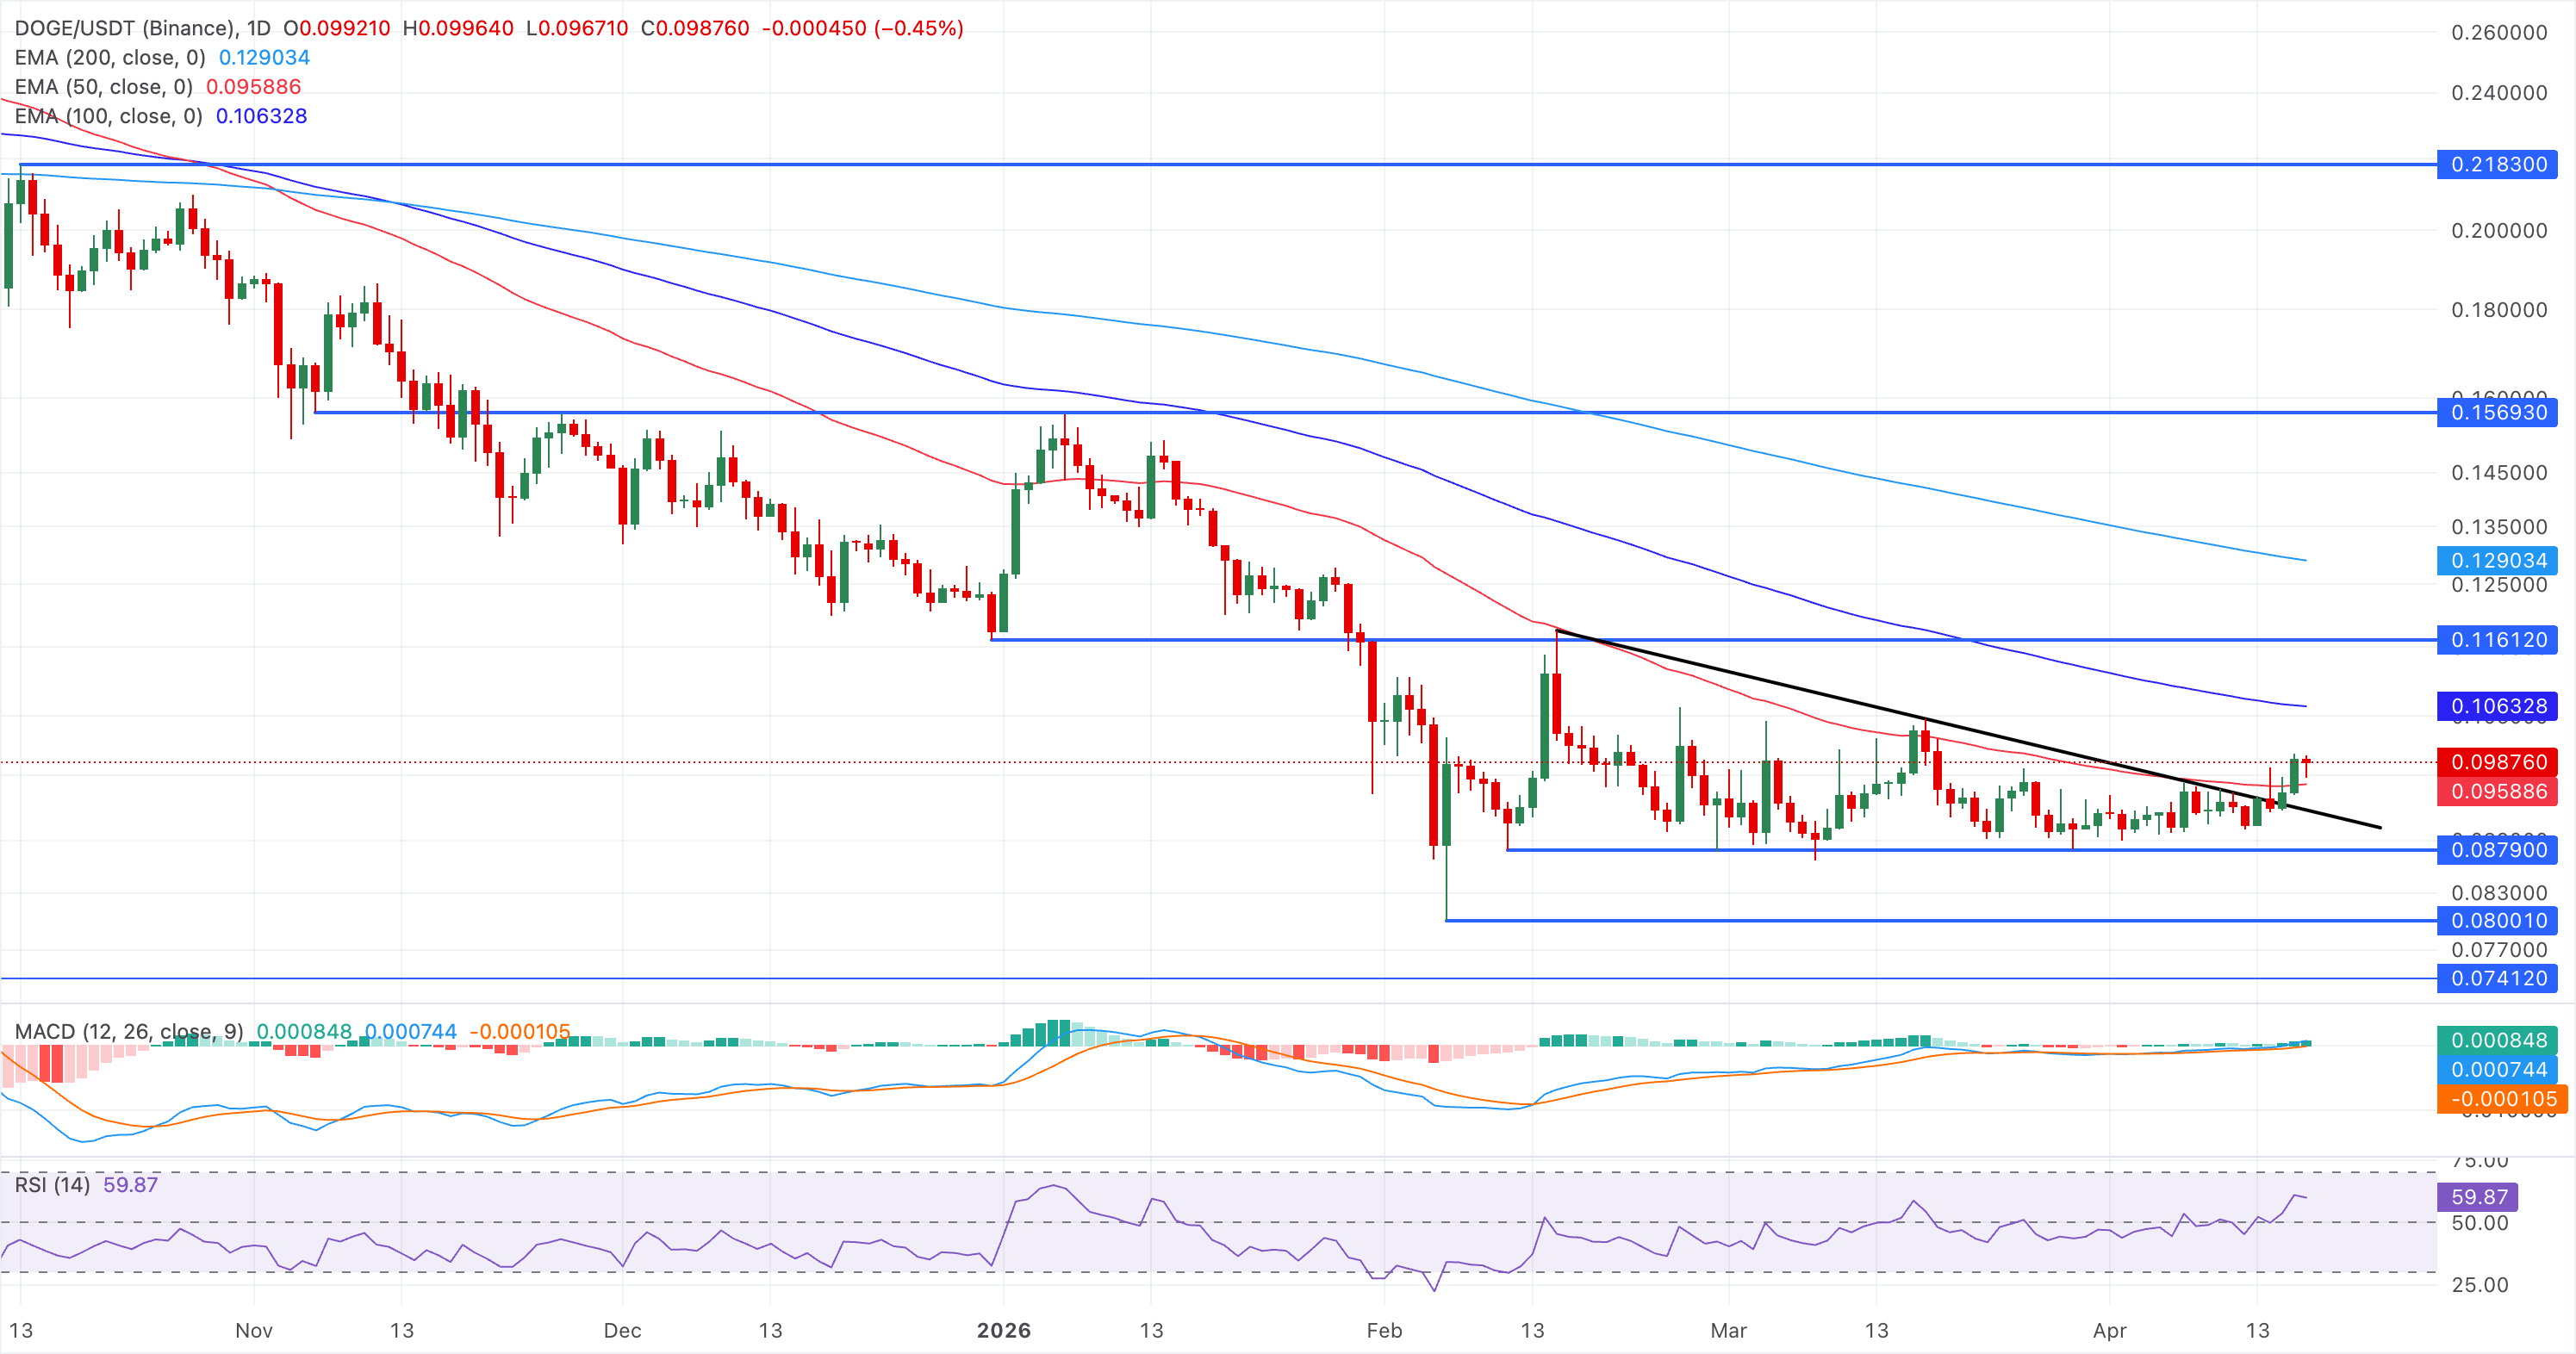
On the downside, any pullback is likely to find initial demand at the 50-day EMA at $0.09588, ahead of the former downtrend line, now support, at $0.0928.
(The technical analysis of this story was written with the help of an AI tool.)
Author

Vishal Dixit
FXStreet
Vishal Dixit holds a B.Sc. in Chemistry from Wilson College but found his true calling in the world of crypto.



