Dogecoin Price Forecast: Mild recovery in sight as retail demand rebuilds
- Dogecoin edges higher on Wednesday after five consecutive days of losses.
- Open Interest and funding rates show renewed interest from retail traders.
- The technical outlook for DOGE is mildly bullish as price tests a crucial demand zone near the $0.1000 psychological threshold.

Dogecoin (DOGE) edges higher on Wednesday, holding ground above its $0.1000 psychological threshold and reviving interest among retail traders.
Early signs of retail support emerge for Dogecoin
CoinGlass data shows the DOGE futures Open Interest (OI) dropped to $1.36 billion on Tuesday, from $1.76 billion during its six-day decline, signaling a broadly risk-off sentiment. However, Dogecoin regains some retail confidence amid a mild intraday recovery.
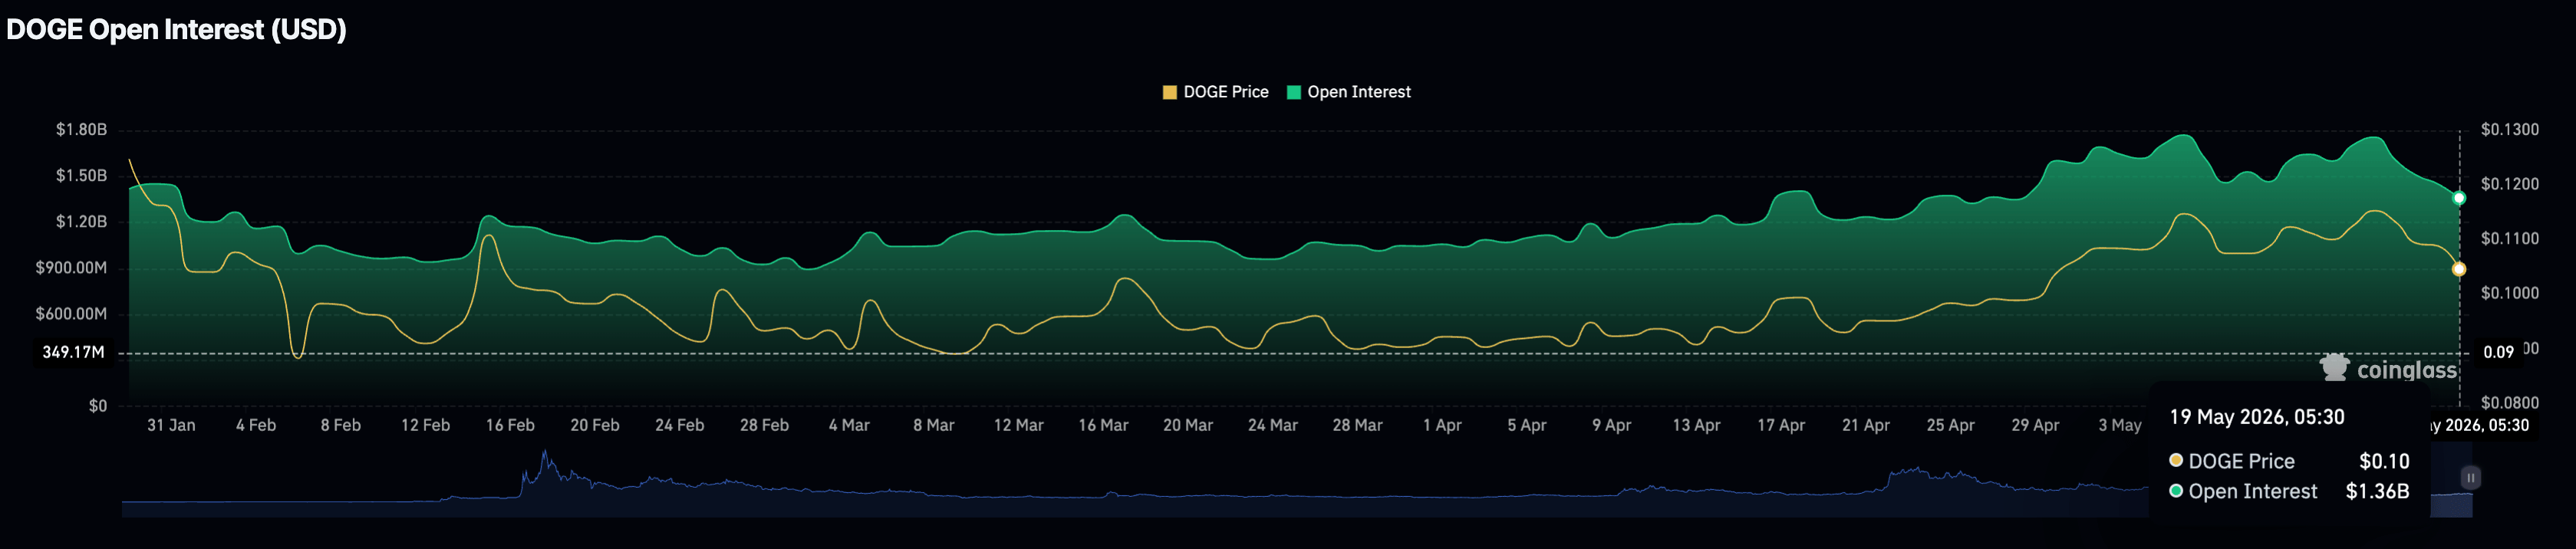
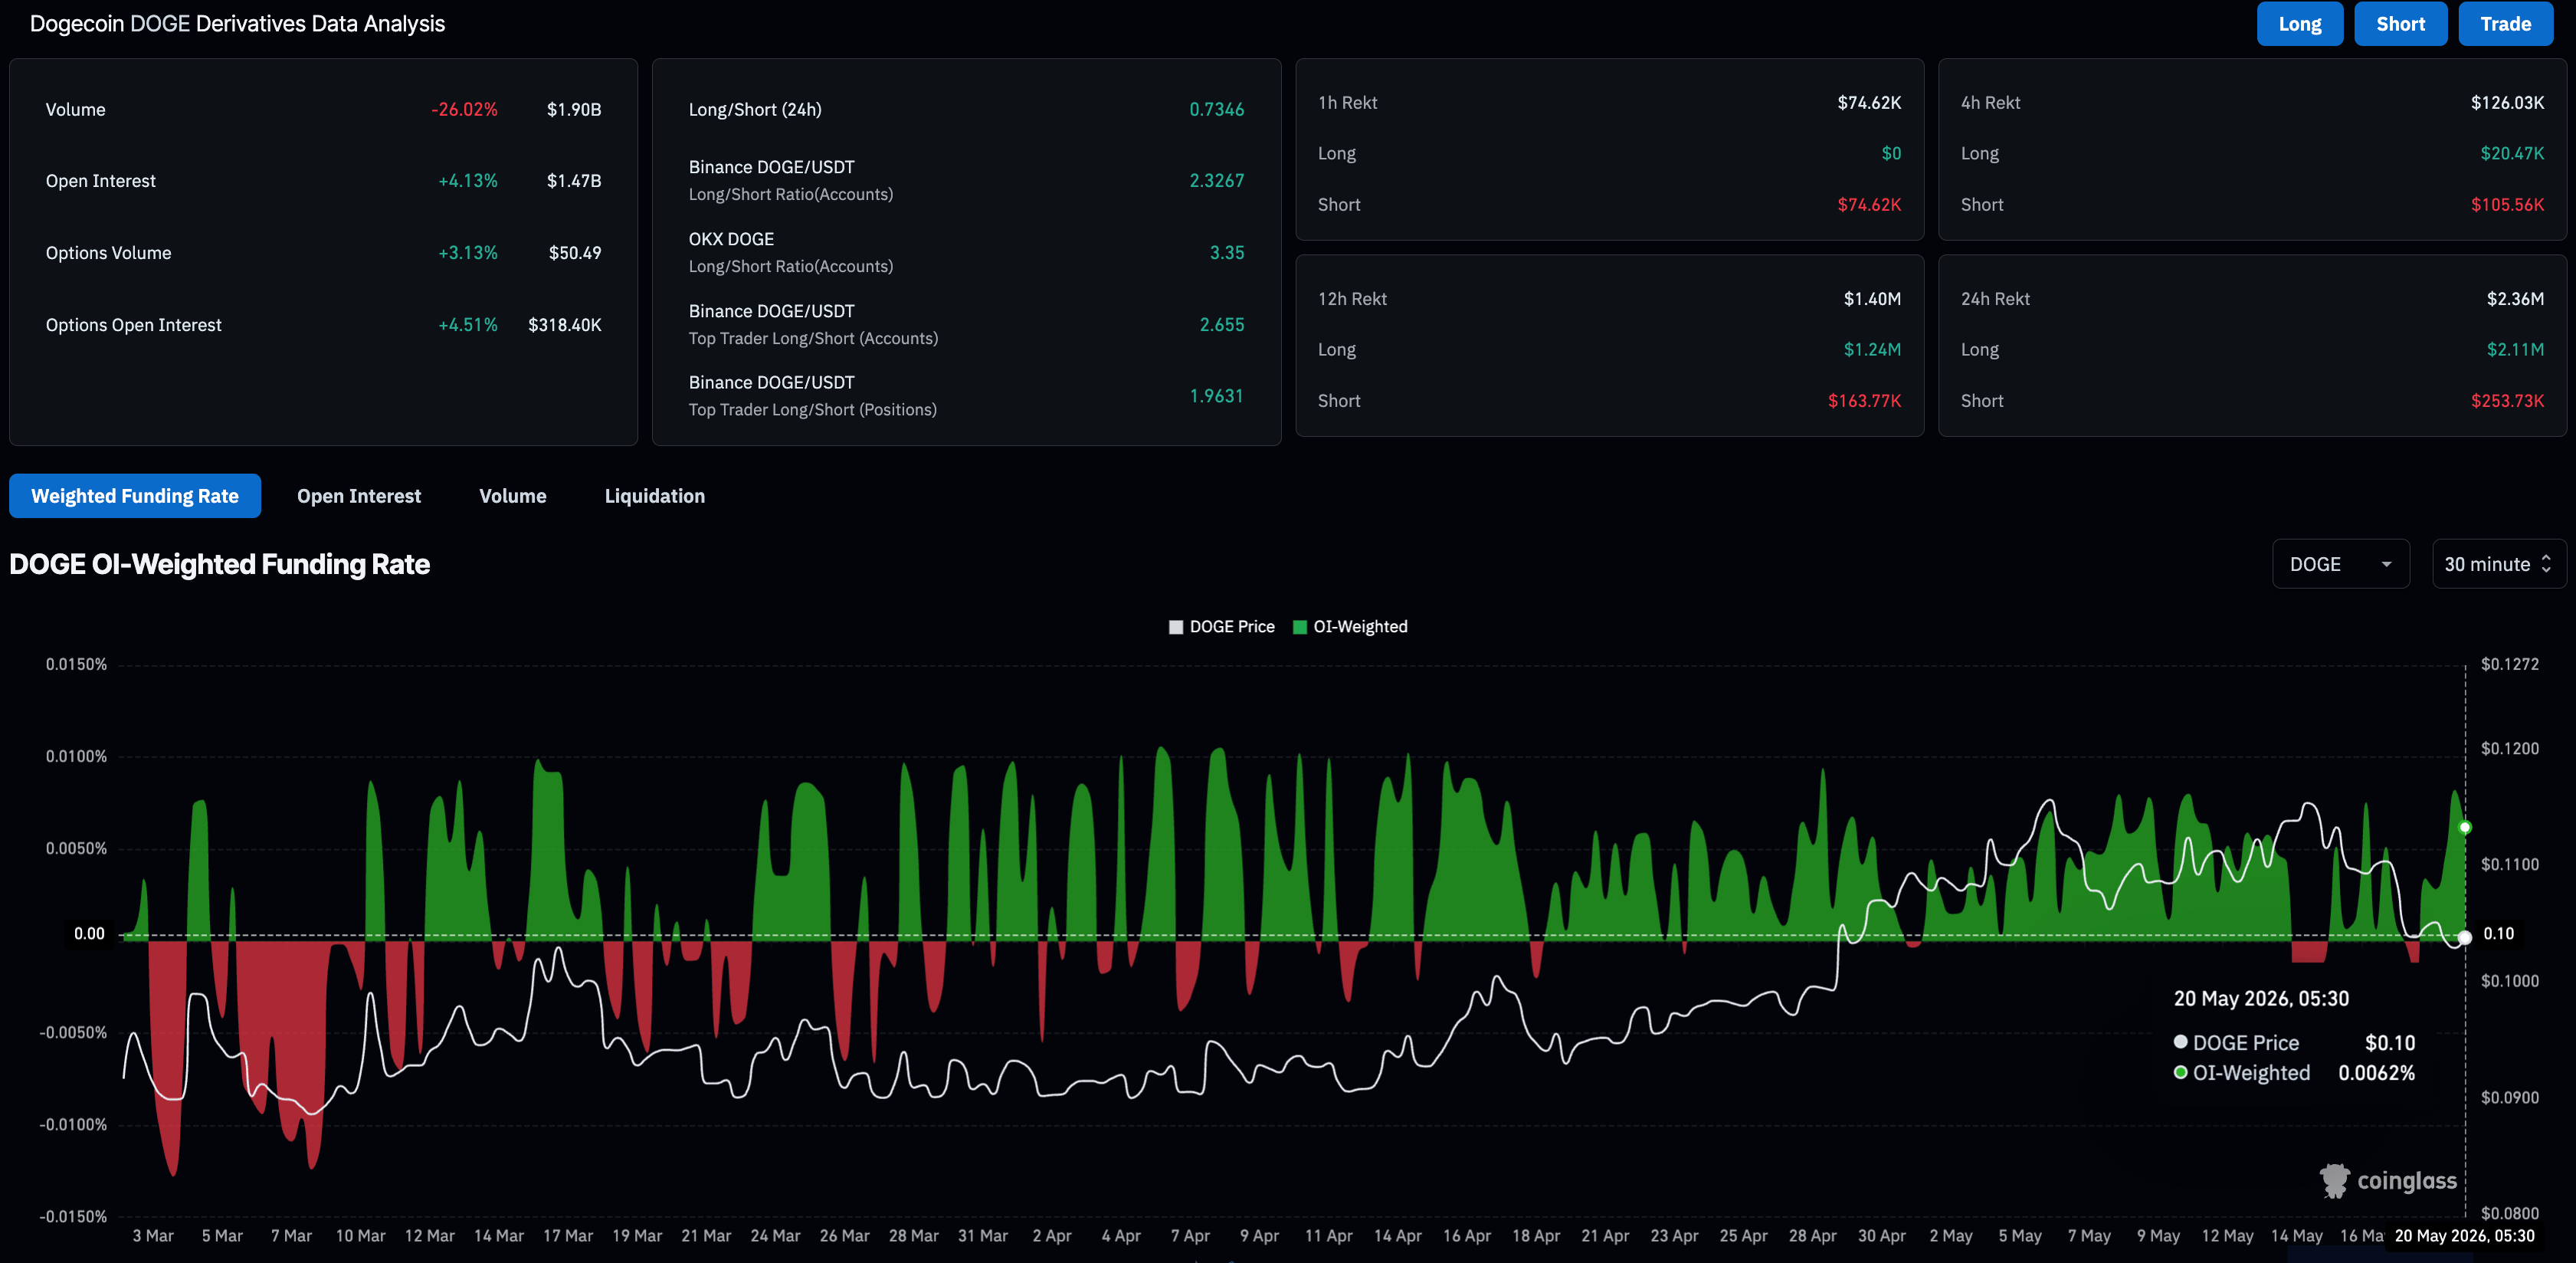
As of Wednesday, DOGE futures OI is up 4% over the last 24 hours, reaching $1.47 billion, suggesting increased positional buildup. The refreshing spike in OI aligns with a surge in the funding rate to 0.0062%, indicating that buyers are willing to take long positions at a premium and build upside anticipation.
Dogecoin's critical support under bearish threat
Dogecoin hovers just below its 50-day Exponential Moving Average (EMA) at $0.1038 while remaining well below the 200-day EMA at $0.1256, which keeps the broader recovery capped and the near-term bias broadly neutral-to-bearish. Still, the meme coin maintains buoyancy above its $0.1000 psychological level amid intraday gains.
A decisive close above the 50-day EMA at $0.1038 could extend the DOGE price rebound toward the $0.1161 resistance level, which capped two bullish attempts earlier this month.
The Relative Strength Index (RSI) has cooled to 45 on the daily chart, crossing below the midline as selling pressure regains control. Meanwhile, the Moving Average Convergence Divergence (MACD) line and its signal line are slipping toward zero after a bearish crossover on Saturday, which triggered a fresh wave of consecutive negative histogram bars. The MACD indicator reaffirms the prevailing selling pressure, while DOGE struggles to hold above $0.1000.
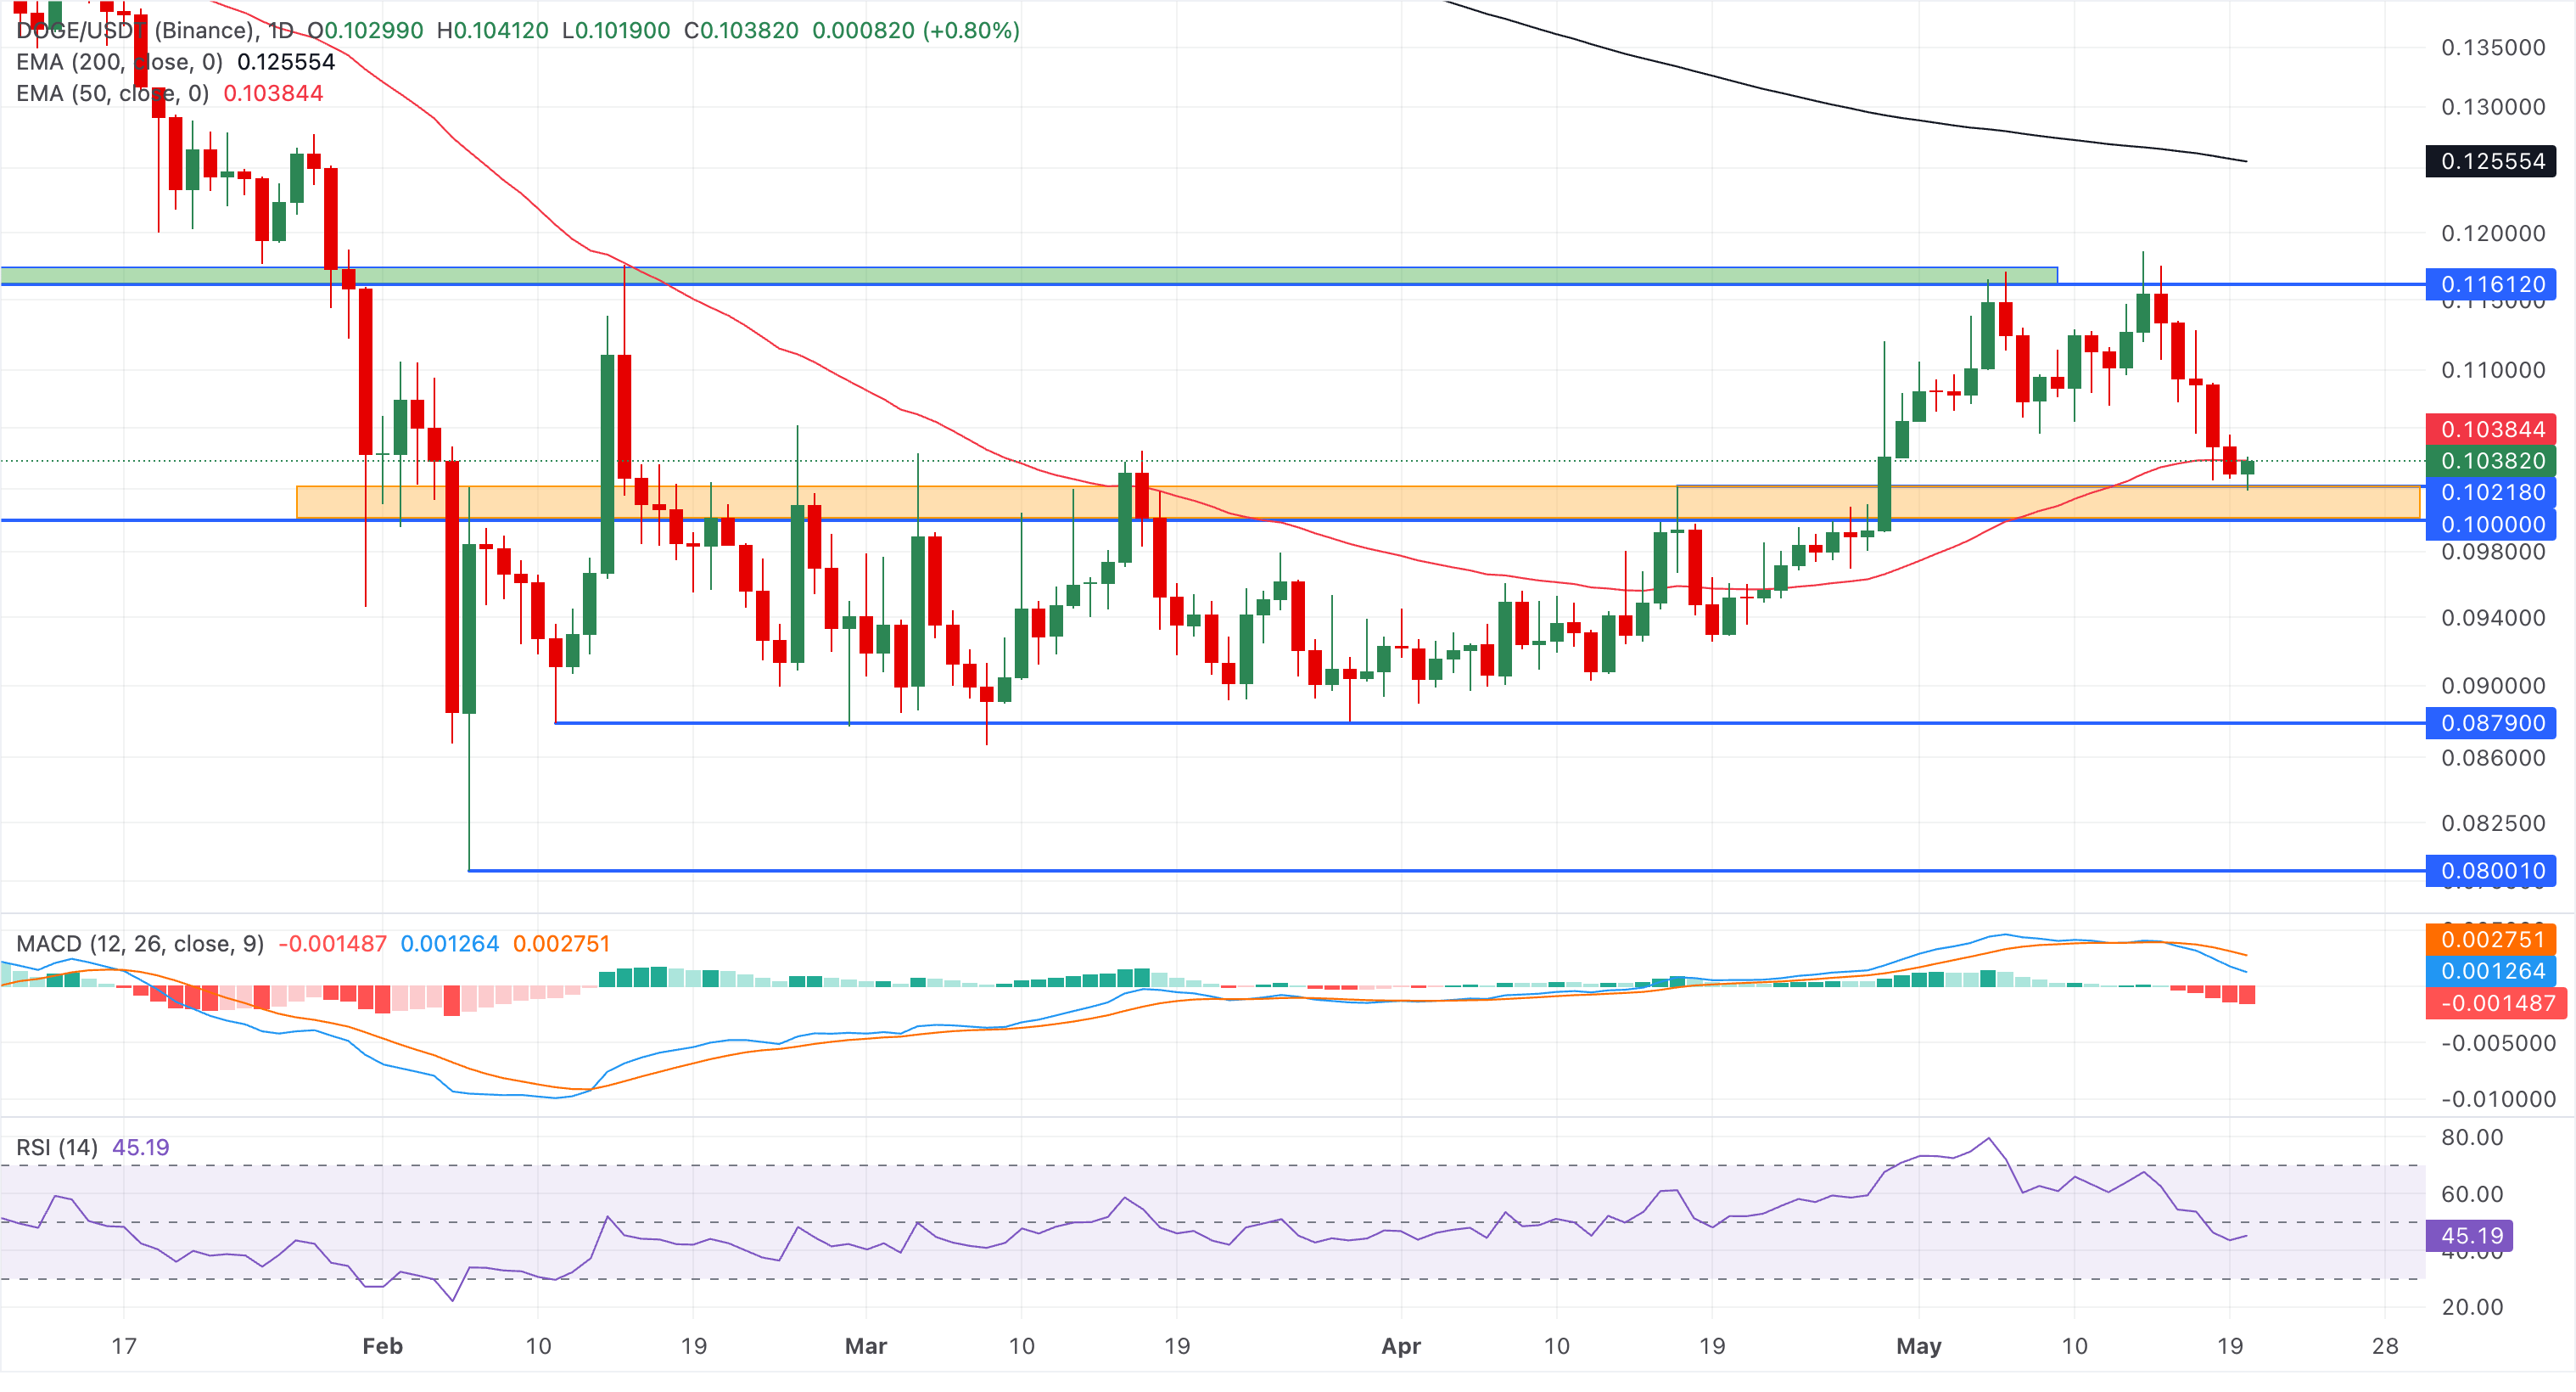
Looking down, a daily close below the technical support floor emerging at $0.1000 could extend the downside risk toward the February 11 low at $0.0879.
(The technical analysis of this story was written with the help of an AI tool.)
Author

Vishal Dixit
FXStreet
Vishal Dixit holds a B.Sc. in Chemistry from Wilson College but found his true calling in the world of crypto.



