Dogecoin Price Forecast: DOGE tests $0.0800 support level amid ETF outflows
- Dogecoin ticks higher on Tuesday, bouncing off the $0.0800 low after a 5% decline the previous day.
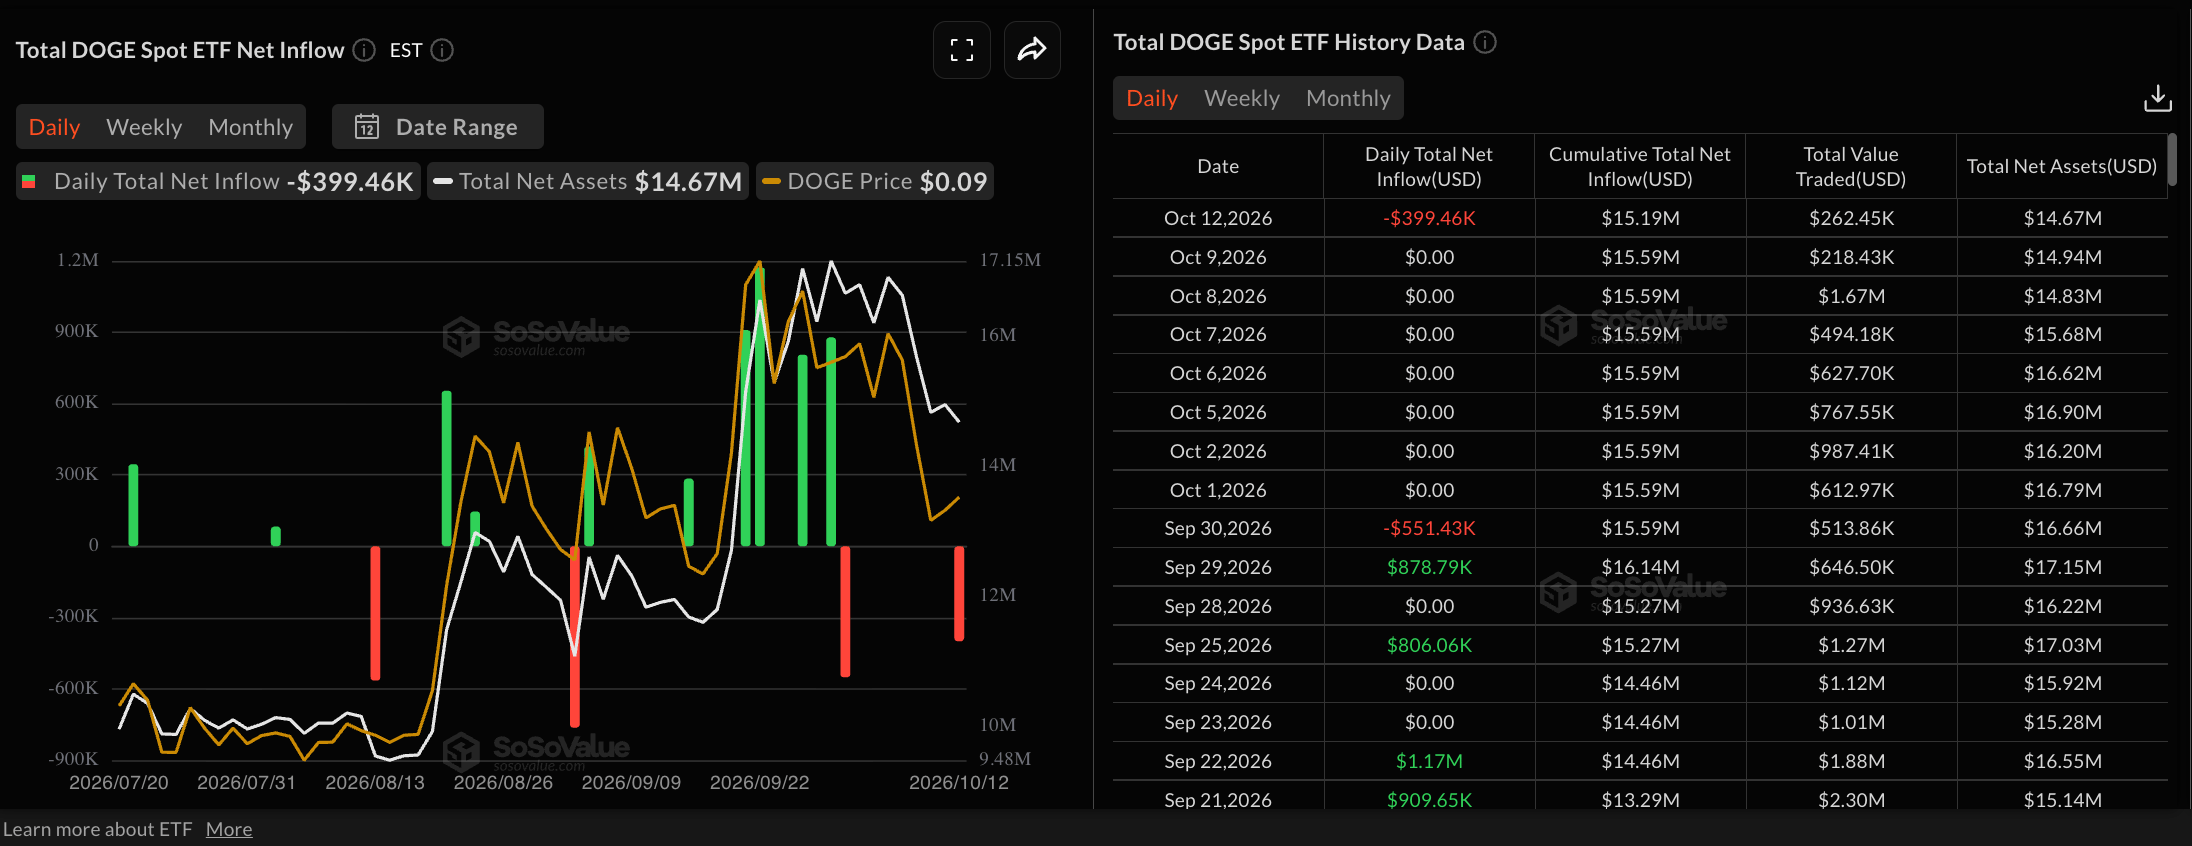
- The meme coin is losing institutional demand, with DOGE ETFs recording nearly $400,000 in outflows on Monday.
- The technical outlook for DOGE suggests downside risk as selling pressure mounts at the $0.0800 support level.

Dogecoin (DOGE) price ticks higher at press time on Tuesday, showing signs of a rebound from the $0.0800 low earlier in the day and the previous day’s 5% decline. DOGE-focused Exchange Traded Funds (ETFs) are facing selling pressure, with nearly $400,000 in outflows on Monday, weighing on the meme coin. Dogecoin risks a decline of over 15% to the $0.0683 support level if prices break below $0.0800.
ETF outflows weigh on DOGE
Dogecoin is losing institutional confidence as the broader cryptocurrency market sees capital rotation to Real-World Assets (RWAs) and Decentralized Finance (DeFi) tokens. DOGE-focused ETFs recorded $399,460 in outflows on Monday, down from net-zero inflows last week, suggesting rising selling pressure driven by investor redemptions.
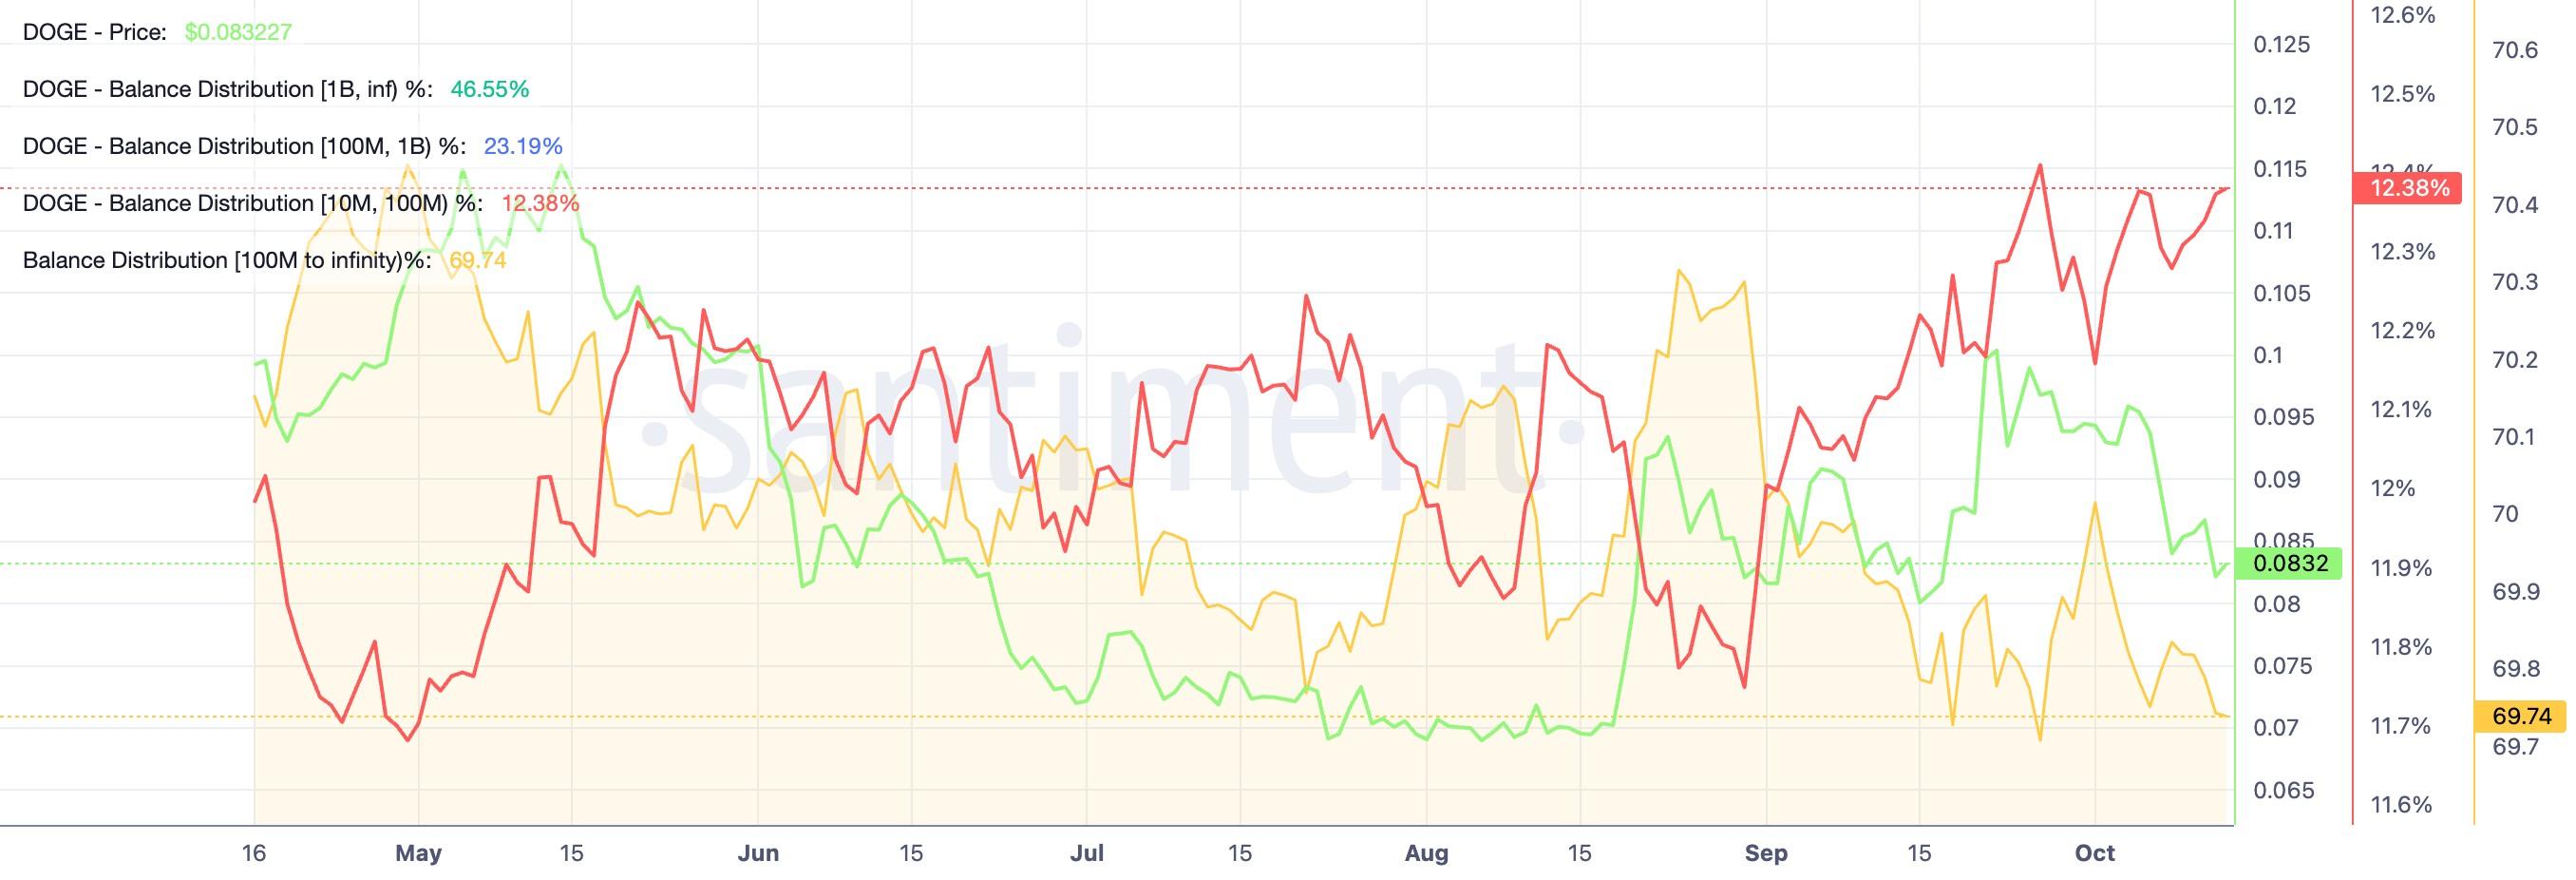
On the other hand, large wallet investors, commonly referred to as whales, holding DOGE are reducing their holdings. Santiment data shows that cohorts with more than 100 million DOGE now hold 69.74% of circulating supply, down from 70.02% on September 1. This indicates a near-term reduction in risk appetite among whales, weighing on the meme coin.
Technical outlook: Will DOGE price hold the fort at $0.0800?
Dogecoin hovers around $0.0829 at press time on Tuesday, keeping a bearish near-term bias. The meme coin price holds below both the 50-day Exponential Moving Average (EMA) at $0.0876 and the 200-day EMA at $0.0923, reinforcing a bearish backdrop.
The Moving Average Convergence Divergence (MACD) crosses below zero, hinting at persistent downside pressure, while the Relative Strength Index (RSI) hovers near 39, approaching oversold territory.
Looking down, a confirmed breakout below the $0.0800 support level, set by the February 6 low, could extend the decline toward the July 23 low at $0.0683, hinting at over 15% downside risk
On the topside, initial resistance is located at the 50-day EMA around $0.0876, with a stronger cap seen at the 200-day EMA near $0.0923, where sellers could reassert control on any rebound.
(The technical analysis of this story was written with the help of an AI tool. Know more.)
Author

Vishal Dixit
FXStreet
Vishal Dixit holds a B.Sc. in Chemistry from Wilson College but found his true calling in the world of crypto.