Dogecoin Price Forecast: DOGE drops as downside pressure expands
- Dogecoin corrects from weekly highs amid Middle East war-driven volatility.
- Low retail activity, with futures Open Interest falling to $1.04 billion, leaves Dogecoin susceptible to losses.
- Dogecoin’s upside is capped by major moving averages sloping lower as the RSI descends.
Dogecoin (DOGE) declines for the second consecutive day, trading above $0.090 at the time of writing on Friday. The meme coin peaked at a weekly high of $0.104 on Wednesday but has since been overwhelmed by volatility amid risk-off sentiment driven by the United States (US)-Israel-Iran war.
Major crypto assets, including Bitcoin (BTC) and Ethereum (ETH), are also correcting as the Middle East war expands, pushing global markets on edge. Governments around the world are worried that the war could escalate Oil and energy prices. The disruption of key shipping routes, such as the Strait of Hormuz, may lead to higher inflation, possibly delaying the expected rate cuts in 2026.
Retail demand wanes as Dogecoin falters
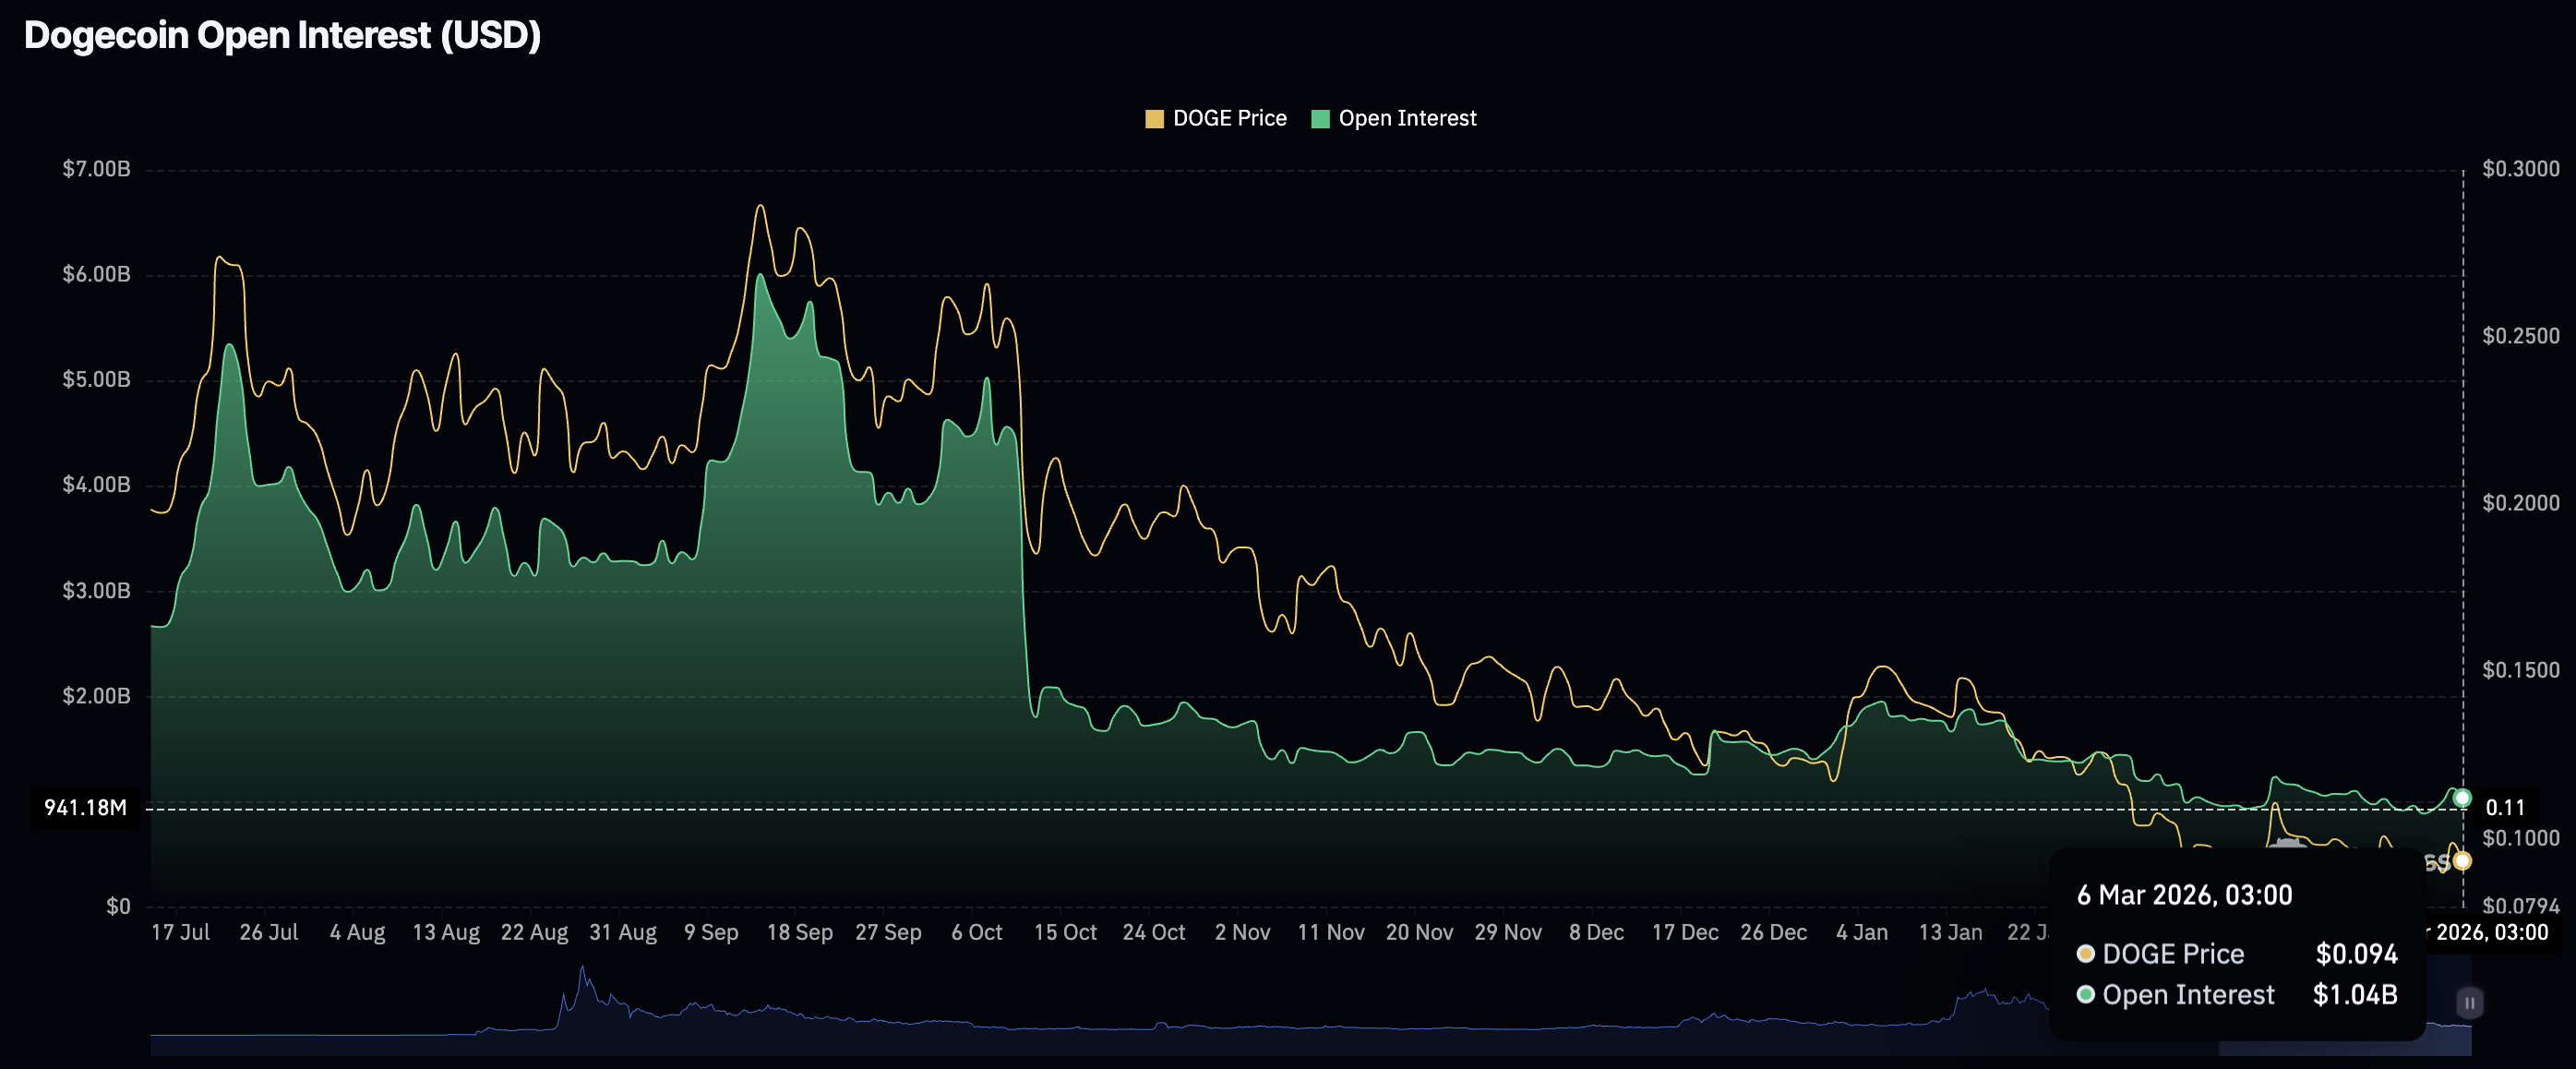
The Dogecoin derivatives market remains significantly weak, as reflected by the drop in futures Open Interest (OI) to $1.04 billion on Friday, from $1.14 billion the previous day.
CoinGlass data show that the OI hit a record $6.01 billion in September but has since declined, mirroring the sticky risk-off sentiment in the broader cryptocurrency market. Bear-market narratives, macroeconomic uncertainty, and geopolitical tensions are among the factors that continue to undermine retail interest in the meme coin.
If OI fails to steadily increase, indicating that investors lack confidence in DOGE, the path of least resistance would remain downward.
Technical outlook: Downside risks deepen as Dogecoin slides
Dogecoin hovers above $0.090 as the near-term bias turns mildly bearish. The meme coin's price continues to fade back from the recent swing at $0.104. The descending resistance trend line caps advances, keeping the broader downtrend intact.
Meanwhile, the Moving Average Convergence Divergence (MACD) indicator remains above its signal line while green histogram bars contract, reflecting easing bullish momentum rather than a firm bullish grip. Moreover, the Relative Strength Index (RSI) sits in the low-40s, consistent with weak bullish pressure inside a prevailing bearish structure.
-1772812860602-1772812860605.png)
Initial resistance emerges around $0.104, where the latest reaction high converges with the trendline resistance. A sustained break above this barrier would expose DOGE to the SuperTrend indicator at $0.11, then to the 100-day EMA at $0.12.
On the downside, immediate support is near $0.09, aligning with the recent swing low zone; a daily close below this level would first target $0.0880, then the $0.0850 area as deeper support.
Open Interest, funding rate FAQs
Higher Open Interest is associated with higher liquidity and new capital inflow to the market. This is considered the equivalent of increase in efficiency and the ongoing trend continues. When Open Interest decreases, it is considered a sign of liquidation in the market, investors are leaving and the overall demand for an asset is on a decline, fueling a bearish sentiment among investors.
Funding fees bridge the difference between spot prices and prices of futures contracts of an asset by increasing liquidation risks faced by traders. A consistently high and positive funding rate implies there is a bullish sentiment among market participants and there is an expectation of a price hike. A consistently negative funding rate for an asset implies a bearish sentiment, indicating that traders expect the cryptocurrency’s price to fall and a bearish trend reversal is likely to occur.
(The technical analysis of this story was written with the help of an AI tool.)
Author

John Isige
FXStreet
John Isige is a seasoned cryptocurrency journalist and markets analyst committed to delivering high-quality, actionable insights tailored to traders, investors, and crypto enthusiasts. He enjoys deep dives into emerging Web3 tren



