Dash slowed down within wave four correction [Video]
![Dash slowed down within wave four correction [Video]](https://editorial.fxsstatic.com/images/i/cryptos-coins.png)
We talked about Dash on October 1st, where we mentioned and highlighted a bullish setup formation. CLICK HERE.
It made a massive rally, so it’s most likely in wave 3 of a five-wave bullish impulse. In the 4-hour chart, we can see it slowing down, but it’s a sideways consolidation, which can be a bullish triangle pattern in wave 4. So, once it’s fully finished, be aware of a bullish resumption within wave 5, especially if it breaks back above 53 bullish confirmation level. In case of deeper and more complex correction, the second support would be at 30-28 area.
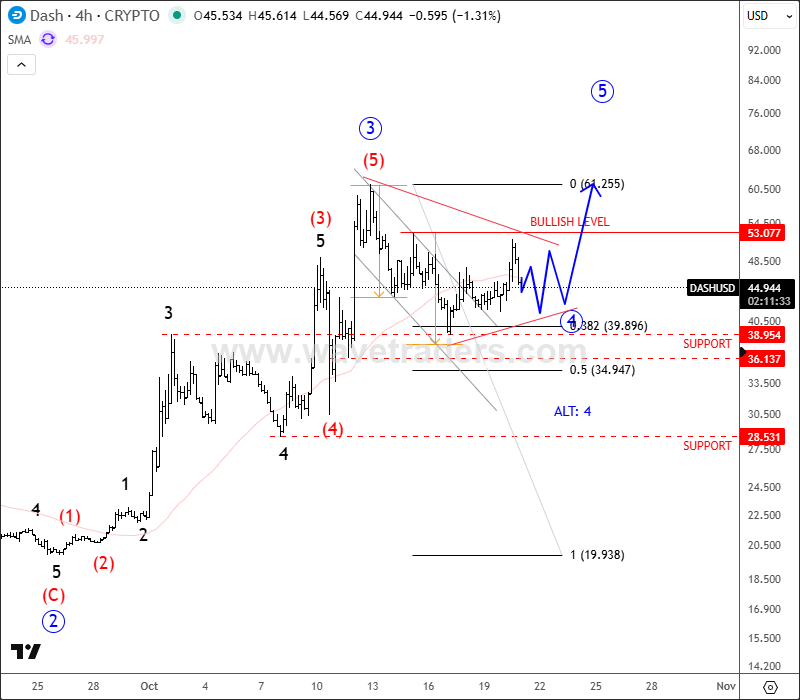
DSH/USD four-hour chart
For more analysis like this, you may want to watch below our latest recording of a live webinar streamed on Monday, October 20:
Get Full Access To Our Premium Elliott Wave Analysis For 14 Days. Click here.
Get Full Access To Our Premium Elliott Wave Analysis For 14 Days. Click here.
Author

Gregor Horvat
Wavetraders
Experience Grega is based in Slovenia and has been in the Forex market since 2003.



